Screener Settings :

* I am still fine tuning my strategy however 16k to 1k works for me right now.
Chart Pattern:
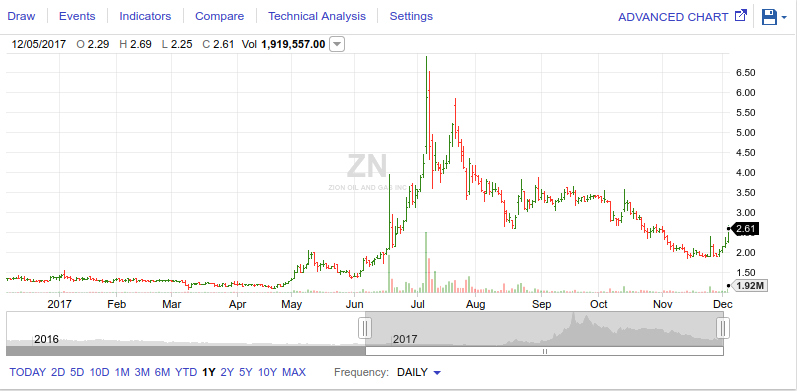
Positives: Previous price action & upward trend.
Negatives: Multi month Run up; May through July. Volume needs to back chart action.
Catalyst: Zion Oil & Gas Shares Spike After Co Gets Multi-Year Extension on Megiddo-Jezreel License
While I realize the news catalyst is over a week out, I can only imagine it has taken time to assimilate into the price action.
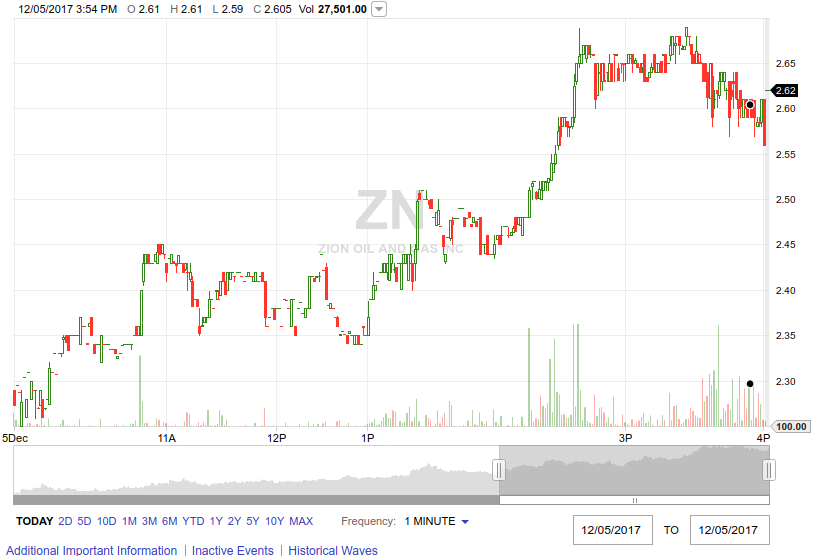
The 1-day chart indicates a pull back with increasing volume. If the support holds pre-market I think it will break through $3.00. Much like DPW did 12/5 very similar pattern.
Trade Plan
Buy: <$2.45 on morning dip Stop Loss threshold - 5% (-$0.1225)
Sell: >$3.185
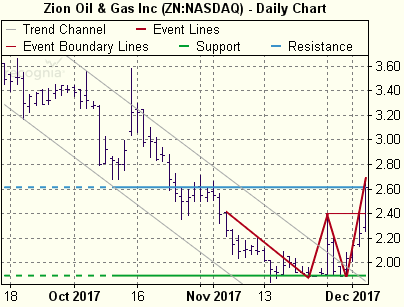 Recognia - Double Bottom Bullish
Join now or log in to leave a comment