Here's the "read me" for how to use the spikability numbers, as well as how to get your own access to the algorithm to run your own backtests. You can get the parameters for the screener and download it for StocksToTrade from this link. It's the "Simple End of Day Gainers" screener. Want more content? Check out the Table of Contents page.
The fundamental data is from STT data and Finviz when I needed to double check stuff. Lots of other tickers on here that were either too big (market cap / shares) or otherwise non volatile.
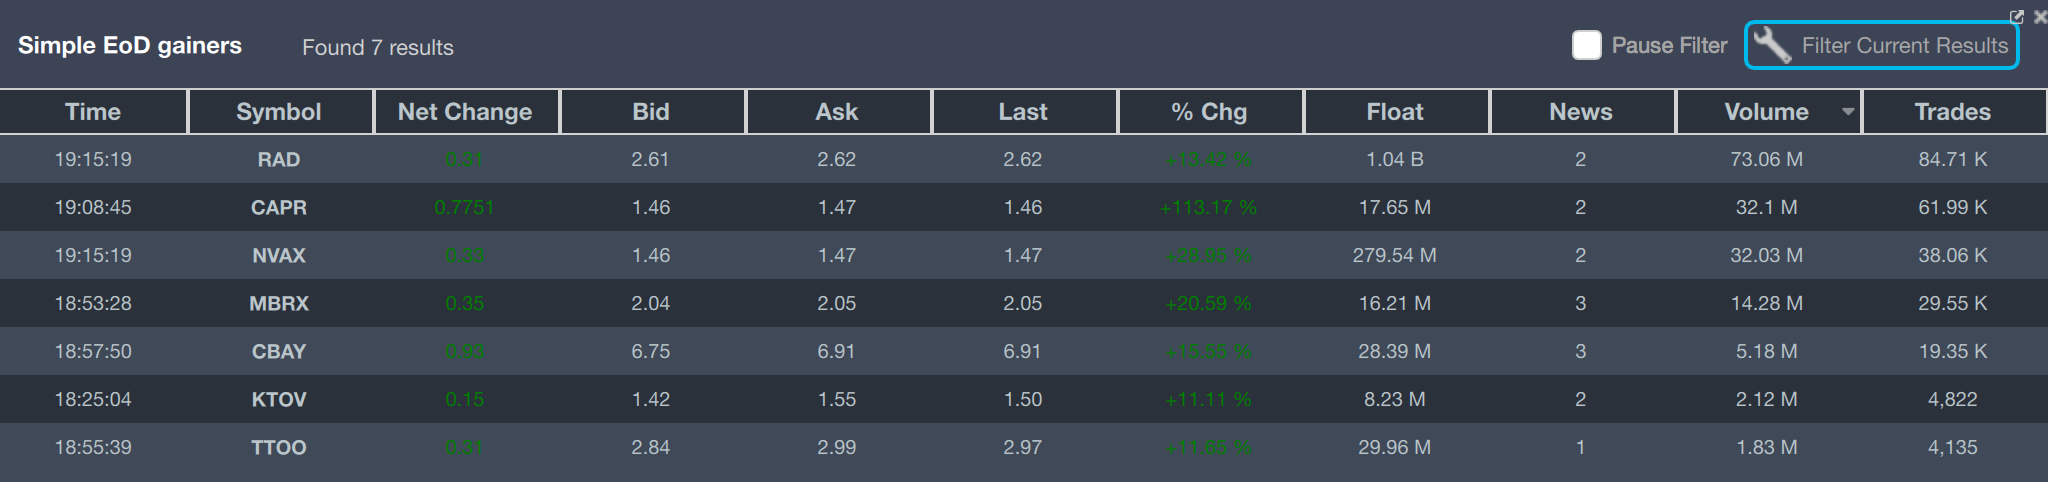
Sorted by volume:
RAD
max 5-year history for RAD
History of large positive moves intraday (open->close):
> 10%-25% : 0 []
> 25%-50% : 2 [43.1, 30.2]
> 50%-100%: 0 []
> 100%+ : 0 []
History of large HOD moves (open->high):
> 25%-50% : 2 [44.2, 33.8]
> 50%-100% : 0 []
> 100%-200%: 0 []
> 200%+ : 0 []
History of gap up moves (close->open):
> 5%-10% : 8 [5.1, 7.5, 5.7, 5.8, 8.8, 5.2, 7.1, 6.2]
> 10%-20% : 5 [12.5, 11.2, 13.5, 12.0, 16.1]
> 20%+ : 0 []
Given a gap up (n=13), statistically the stock closes:
> +10% or better: 0.0%
> +5% to +10% : 15.4%
> unch (+/- 5%) : 84.6%
> -5% to -10% : 0.0%
> -10% or worse : 0.0%
Given a +10% day (n=7), vs day 1 close, the 2nd day will open:
> Higher and close green: 28.6%
> Lower and close green : 28.6%
> Higher and close red : 28.6%
> Lower and close red : 14.3%
Holistic spikability score: 0.375 / 10
RAD - Rite Aid Corporation (NYSE)
Consumer Defensive / Retail - Defensive / Pharmaceutical Retailers, 87000 FT Employ
2.75B Cap, 1.05B shares outstanding, 1.04 float
0%, 56.6%, 4% insider / institution / short (prior month)
Cash (mrq) 214M, QUICK (mrq) 1.7, Cashflow (ttm) 225M
Catalyst - positive earnings
Price action - big move after hours yesterday, breached yesterday’s after hours lows then uptrended all day. Long term chart is crap, like most of retail this year.
Stats prediction - second day has slightly higher odds of closing higher than closing lower but those are crap odds.
CAPR
max 5-year history for CAPR
History of large positive moves intraday (open->close):
> 10%-25% : 1 [10.8]
> 25%-50% : 0 []
> 50%-100%: 0 []
> 100%+ : 0 []
History of large HOD moves (open->high):
> 25%-50% : 0 []
> 50%-100% : 0 []
> 100%-200%: 0 []
> 200%+ : 0 []
History of gap up moves (close->open):
> 5%-10% : 2 [7.9, 5.8]
> 10%-20% : 1 [11.7]
> 20%+ : 1 [25.5]
Given a gap up (n=4), statistically the stock closes:
> +10% or better: 0.0%
> +5% to +10% : 0.0%
> unch (+/- 5%) : 25.0%
> -5% to -10% : 25.0%
> -10% or worse : 50.0%
Given a +10% day (n=1), vs day 1 close, the 2nd day will open:
> Higher and close green: 0.0%
> Lower and close green : 100.0%
> Higher and close red : 0.0%
> Lower and close red : 0.0%
Holistic spikability score: 0.0 / 10
CAPR - Capricor Therapeutics Inc. (NASDAQ)
Healthcare / Biotechnology / Biotechnology 40 FT Employees
64.5M cap, 22.6M shares outstanding, 17.65M float
21.9% / 21.2% / 0.7% insider / institution / short (prior mont)
Cash (mrq) 11.74M, QUICK (mrq) 4.1, Cashflow (ttm) -15.8M
Catalyst - Rare pediatric disease designation for CAP-1002 drug, helps with future development by allowing a marketing application to get priority review. Looks like a short squeeze except the prior month short ratio. Also now at “gap fill” to the prior highs after the drop on poor drug news in May. Looks like a momo run from prermarket move and hype.
Price action - premarket bump and quick test of over/under 1. Nice VWAP hold on pullbacks until mid day with a strong pull but bounced the rest of the day with an initially weak close and then recovery into extended hours. Could have some more momentum as other biotech have done with similar price action and history, but could also wash hard.
Stats prediction - historically unvolatile, all gaps go unchanged or down, but 2nd day has 100% odds of closing green… off 1 sample point. Yeah, odds suck for this one.
NVAX
max 5-year history for NVAX
History of large positive moves intraday (open->close):
> 10%-25% : 15 [18.9, 10.1, 13.5, 10.8, 10.2, 12.6, 13.1, 11.3, 15.2, 18.1, 12.3, 14.1, 14.0, 10.4, 10.9]
> 25%-50% : 2 [27.9, 30.1]
> 50%-100%: 0 []
> 100%+ : 0 []
History of large HOD moves (open->high):
> 25%-50% : 3 [30.3, 43.6, 30.2]
> 50%-100% : 0 []
> 100%-200%: 0 []
> 200%+ : 0 []
History of gap up moves (close->open):
> 5%-10% : 13 [8.1, 5.3, 6.5, 8.9, 7.2, 8.1, 6.7, 6.1, 7.7, 7.3, 7.1, 8.9, 5.6]
> 10%-20% : 8 [10.3, 11.6, 11.1, 10.2, 10.5, 11.4, 15.6, 11.9]
> 20%+ : 0 []
Given a gap up (n=21), statistically the stock closes:
> +10% or better: 4.8%
> +5% to +10% : 14.3%
> unch (+/- 5%) : 57.1%
> -5% to -10% : 19.0%
> -10% or worse : 4.8%
Given a +10% day (n=28), vs day 1 close, the 2nd day will open:
> Higher and close green: 14.3%
> Lower and close green : 25.0%
> Higher and close red : 46.4%
> Lower and close red : 14.3%
Holistic spikability score: 0.375 / 10
NVAX - Novavax Inc. (NASDAQ)
Healthcare / Biotechnology / Biotechnology 355 FT employees
396M cap, 282M shares outstanding, 279M float
Cash (mrq) 211M, QUICK (mrq) 4.6, Cashflow (ttm) -255M
Catalyst - … accesswire research report? After hours pop yesterday on news that NVAX is hosting an update on one of their drugs.
Price action - pretty boring for the prior four days, AF pop yesterday on news, dip to prior day “channel” (like 2 cent difference, sort of a channel) and then a trend all day with a pull and recover into the close. AH is quiet. Long term, cliff dive mid september last year and otherwise sideways.
Stats prediction - Not a ton of historical volatility, some gaps typical of biotech and pretty even odds of going high or low on a gap up with greatest weight at staying unchanged. 2nd day odds lean towards closing red.
MBRX
max 5-year history for MBRX
History of large positive moves intraday (open->close):
> 10%-25% : 9 [14.5, 15.4, 16.8, 12.5, 10.2, 13.9, 18.4, 20.6, 11.0]
> 25%-50% : 2 [41.5, 33.1]
> 50%-100%: 2 [54.1, 73.7]
> 100%+ : 0 []
History of large HOD moves (open->high):
> 25%-50% : 3 [36.0, 26.3, 27.7]
> 50%-100% : 4 [56.1, 84.9, 62.9, 81.7]
> 100%-200%: 0 []
> 200%+ : 0 []
History of gap up moves (close->open):
> 5%-10% : 6 [9.8, 7.3, 8.7, 6.1, 5.2, 8.7]
> 10%-20% : 2 [15.0, 10.8]
> 20%+ : 1 [34.3]
Given a gap up (n=9), statistically the stock closes:
> +10% or better: 33.3%
> +5% to +10% : 22.2%
> unch (+/- 5%) : 22.2%
> -5% to -10% : 22.2%
> -10% or worse : 0.0%
Given a +10% day (n=14), vs day 1 close, the 2nd day will open:
> Higher and close green: 21.4%
> Lower and close green : 7.1%
> Higher and close red : 42.9%
> Lower and close red : 28.6%
Holistic spikability score: 2.0 / 10
MBRX - Moleculin Biotech Inc. (NASDAQ)
Healthcare / Biotechnology / Biotechnology 6 FT employees
29.2M cap, 17.76M shares outstanding, 16.21M float
0% / 4.4% / 14.9% insider / institution / short (prior month)
Cash (mrq) 8.88M, QUICK (mrq) 4.2, Cashflow (ttm) -3.7M
Catalyst - Drug distribution licensing agreement.
Price action - nice breakout on the five day from a channel / bottom after the late June run up. Low volume since the three big volume green days so anyone holding short might have been caught up in a bit of a squeeze. The prior run up in late June was a great Fous4 Gold pattern with the $1 ceiling, looking back on the multiway.
Stats prediction - Some decent volatility, holistic is still low though because of no 100%+ runs or HODs. 2nd day odds are biased to close red.
CBAY
max 5-year history for CBAY
History of large positive moves intraday (open->close):
> 10%-25% : 17 [14.1, 10.6, 24.9, 12.0, 19.3, 11.3, 16.7, 12.6, 11.1, 10.8, 12.6, 15.1, 11.8, 16.5, 13.8, 19.0, 10.8]
> 25%-50% : 4 [30.5, 26.3, 26.4, 28.7]
> 50%-100%: 0 []
> 100%+ : 0 []
History of large HOD moves (open->high):
> 25%-50% : 6 [39.3, 28.4, 27.1, 30.3, 33.3, 33.3]
> 50%-100% : 0 []
> 100%-200%: 0 []
> 200%+ : 0 []
History of gap up moves (close->open):
> 5%-10% : 8 [6.6, 6.1, 6.7, 7.5, 8.2, 5.0, 8.9, 8.8]
> 10%-20% : 0 []
> 20%+ : 2 [40.5, 22.1]
Given a gap up (n=10), statistically the stock closes:
> +10% or better: 10.0%
> +5% to +10% : 0.0%
> unch (+/- 5%) : 40.0%
> -5% to -10% : 10.0%
> -10% or worse : 40.0%
Given a +10% day (n=20), vs day 1 close, the 2nd day will open:
> Higher and close green: 15.0%
> Lower and close green : 15.0%
> Higher and close red : 40.0%
> Lower and close red : 30.0%
Holistic spikability score: 0.75 / 10
CBAY - CymaBay Therapeutics Inc. (NASDAQ)
Healthcare / Biotechnology / Biotechnology 22 FT employees
44.8M cap, 28.75M shares outstanding, 28.39M float
0% / 34% / 2.6% insider / institution / short (prior month)
Cash (mrq) 23.4M, QUICK (mrq) 2.3, cashflow (ttm) -23,3M
Catalyst - price dropped in premarket after stock offering announcement filed this morning but effective July 14th.
Price action - Rebound was a trend continuation and then over shoot relative to the multi-month channel formed since November last year. Strong trend. Nice recovering on multiple offerings in the past few months.
Stats prediction - low volatility historically. 2nd day on +10% day biases to close red.
KTOV
max 5-year history for KTOV
History of large positive moves intraday (open->close):
> 10%-25% : 4 [13.5, 14.7, 10.1, 15.7]
> 25%-50% : 2 [40.5, 30.6]
> 50%-100%: 0 []
> 100%+ : 0 []
History of large HOD moves (open->high):
> 25%-50% : 5 [31.7, 26.2, 28.1, 43.1, 33.5]
> 50%-100% : 1 [50.0]
> 100%-200%: 0 []
> 200%+ : 0 []
History of gap up moves (close->open):
> 5%-10% : 8 [6.0, 8.4, 5.3, 6.0, 6.0, 9.5, 8.4, 6.9]
> 10%-20% : 2 [19.0, 18.9]
> 20%+ : 1 [45.6]
Given a gap up (n=11), statistically the stock closes:
> +10% or better: 18.2%
> +5% to +10% : 0.0%
> unch (+/- 5%) : 54.5%
> -5% to -10% : 18.2%
> -10% or worse : 9.1%
Given a +10% day (n=7), vs day 1 close, the 2nd day will open:
> Higher and close green: 14.3%
> Lower and close green : 0.0%
> Higher and close red : 14.3%
> Lower and close red : 71.4%
Holistic spikability score: 0.375 / 10
KTOV - low volume, lower percentage move, skipping deep dive for this one.
TTOO
max 5-year history for TTOO
History of large positive moves intraday (open->close):
> 10%-25% : 2 [10.1, 10.3]
> 25%-50% : 1 [25.2]
> 50%-100%: 0 []
> 100%+ : 0 []
History of large HOD moves (open->high):
> 25%-50% : 1 [29.6]
> 50%-100% : 0 []
> 100%-200%: 0 []
> 200%+ : 0 []
History of gap up moves (close->open):
> 5%-10% : 6 [5.0, 6.4, 8.8, 7.1, 6.4, 8.0]
> 10%-20% : 1 [14.1]
> 20%+ : 1 [29.0]
Given a gap up (n=8), statistically the stock closes:
> +10% or better: 12.5%
> +5% to +10% : 0.0%
> unch (+/- 5%) : 62.5%
> -5% to -10% : 12.5%
> -10% or worse : 12.5%
Given a +10% day (n=3), vs day 1 close, the 2nd day will open:
> Higher and close green: 0.0%
> Lower and close green : 0.0%
> Higher and close red : 33.3%
> Lower and close red : 66.7%
Holistic spikability score: 0.1875 / 10
TTOO - low volume, lower percentage move, skipping deep dive for this one.
Bit faster than yesterday but still a bit slow.
Want more? Check out the Table of Contents page.
Join now or log in to leave a comment