Here's the "read me" for how to use the spikability numbers, as well as how to get your own access to the algorithm to run your own backtests. You can get the parameters for the screener and download it for StocksToTrade from this link. It's the "Simple End of Day Gainers" screener. Want more content? Check out the Table of Contents page.
The fundamental data is from STT data and Finviz when I needed to double check stuff. Lots of other tickers on here that were either too big (market cap / shares) or otherwise non volatile.
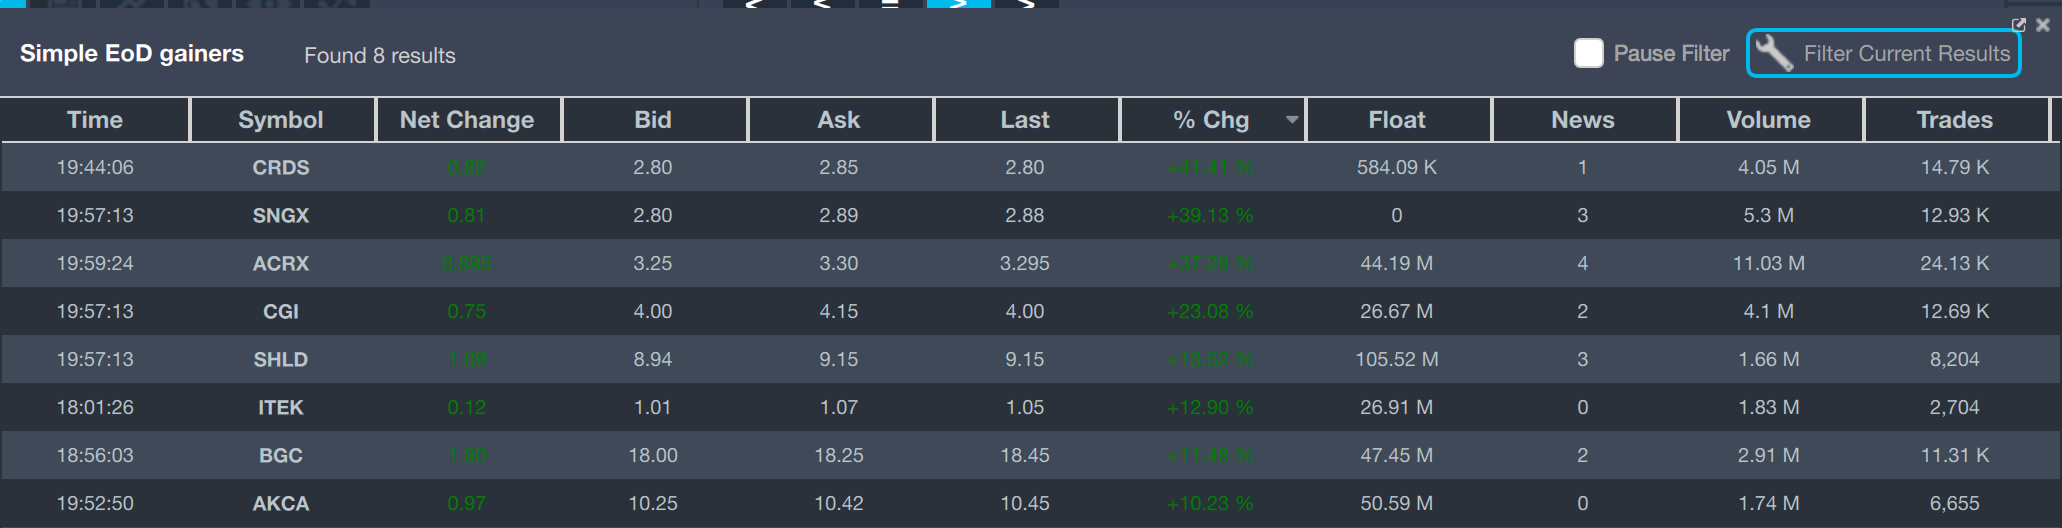
Sorted by volume:
ACRX
max 5-year history for ACRX
History of large positive moves intraday (open->close):
> 10%-25% : 15 [11.3, 12.5, 13.5, 10.8, 11.3, 10.5, 11.7, 10.1, 13.6, 13.7, 11.4, 16.4, 13.4, 17.5, 11.1]
> 25%-50% : 0 []
> 50%-100%: 0 []
> 100%+ : 0 []
History of large HOD moves (open->high):
> 25%-50% : 0 []
> 50%-100% : 0 []
> 100%-200%: 0 []
> 200%+ : 0 []
History of gap up moves (close->open):
> 5%-10% : 13 [6.5, 5.7, 7.6, 5.9, 5.5, 5.6, 6.3, 6.8, 7.4, 5.9, 7.9, 7.2, 9.4]
> 10%-20% : 8 [10.3, 12.4, 10.2, 17.9, 10.9, 16.0, 13.4, 11.2]
> 20%+ : 1 [29.7]
Given a gap up (n=22), statistically the stock closes:
> +10% or better: 9.1%
> +5% to +10% : 0.0%
> unch (+/- 5%) : 40.9%
> -5% to -10% : 36.4%
> -10% or worse : 13.6%
Given a +10% day (n=21), vs day 1 close, the 2nd day will open:
> Higher and close green: 33.3%
> Lower and close green : 14.3%
> Higher and close red : 38.1%
> Lower and close red : 14.3%
Holistic spikability score: 0.0 / 10
ACRX - AcelRx Pharmaceuticals Inc. (NASDAQ)
Healthcare / Medical Devices / Medical Devices, 38 FT employees
147M cap, 45.4M shares outstanding, 44.2M float
0% / 26.8% / 7.5% insider, institution, short (prior month)
Cash (mrq) 72M, QUICK (mrq) 6.1, Cash flow (ttm) -29M
Catalyst - looks like analyst PT of $7 on Friday was the major “recent” news. Phase 3 drug results out in July with an FDA decision in Oct.
Price Action - I hate 5 cent spread stocks. Two day trend continuation, now playing in the early Feb to late April channel from a 6 month perspective, and it looks like that channel goes pretty far back to the beginning of 2016. Spikability history also sucks.
SNGX
max 5-year history for SNGX
History of large positive moves intraday (open->close):
> 10%-25% : 3 [12.0, 18.8, 12.2]
> 25%-50% : 0 []
> 50%-100%: 0 []
> 100%+ : 0 []
History of large HOD moves (open->high):
> 25%-50% : 3 [30.4, 27.0, 25.5]
> 50%-100% : 0 []
> 100%-200%: 0 []
> 200%+ : 0 []
History of gap up moves (close->open):
> 5%-10% : 2 [5.1, 5.7]
> 10%-20% : 0 []
> 20%+ : 1 [53.8]
Given a gap up (n=3), statistically the stock closes:
> +10% or better: 33.3%
> +5% to +10% : 0.0%
> unch (+/- 5%) : 0.0%
> -5% to -10% : 33.3%
> -10% or worse : 33.3%
Given a +10% day (n=4), vs day 1 close, the 2nd day will open:
> Higher and close green: 0.0%
> Lower and close green : 50.0%
> Higher and close red : 0.0%
> Lower and close red : 50.0%
Holistic spikability score: 0.0 / 10
SNGX - Soligenix Inc. (NASDAQ)
Healthcare / Biotechnology / Biotechnology, 19 FT employees
16.39M cap, 5.67M shares outstanding, “0” float but 0% insider held so assume 5.67M shares in float.
Cash (mrq) 7.14M, QUICK (mrq) 3.2, Cash flow (ttm) -4.9M
Catalyst - Positive analyst report from Wainwright, looks like not much else recently.
Price Action - Jump out the gate, FU pattern falling below VWAP after 10AM but reclaimed over VWAP after 11:15, bouncing a few times and holding the rest of the day. Long term downtrend and spikability historical numbers suck.
CGI
max 5-year history for CGI
History of large positive moves intraday (open->close):
> 10%-25% : 7 [13.0, 12.9, 10.8, 16.7, 10.6, 15.2, 21.6]
> 25%-50% : 0 []
> 50%-100%: 0 []
> 100%+ : 0 []
History of large HOD moves (open->high):
> 25%-50% : 1 [37.8]
> 50%-100% : 0 []
> 100%-200%: 0 []
> 200%+ : 0 []
History of gap up moves (close->open):
> 5%-10% : 9 [8.6, 6.4, 5.6, 6.0, 5.1, 5.0, 5.3, 5.3, 7.5]
> 10%-20% : 1 [10.1]
> 20%+ : 0 []
Given a gap up (n=10), statistically the stock closes:
> +10% or better: 0.0%
> +5% to +10% : 20.0%
> unch (+/- 5%) : 40.0%
> -5% to -10% : 40.0%
> -10% or worse : 0.0%
Given a +10% day (n=14), vs day 1 close, the 2nd day will open:
> Higher and close green: 28.6%
> Lower and close green : 42.9%
> Higher and close red : 14.3%
> Lower and close red : 14.3%
Holistic spikability score: 0.0 / 10
CGI - Celadon Group Inc. (NYSE)
Industrials / Transportation & Logistics / Trucking, 5979 FT employees
114.51M Cap, 28.3M shares outstanding 26.7M float
0% / 0% / 23.2% industry / institution / short (prior month)
Cash (mrq) 6.14M, QUICK (mrq) 0.9, Cashflow (ttm) -5.2M
Catalyst - Accesswire says it’s because of new leadership. Meh.
Price Action - 5 cent stock, bleh. volume came in spurts throughout the day with a morning pop, slow traingle from 10 to 2:30 and a push into end of day. Choppy volume confirmation. Looking back, it’s a gap fill from early May gap down and now looking at the ceiling and chop area from a long term downtrend. The historical numbers also suck.
CRDS
max 5-year history for CRDS
History of large positive moves intraday (open->close):
> 10%-25% : 2 [14.8, 20.4]
> 25%-50% : 1 [42.5]
> 50%-100%: 0 []
> 100%+ : 0 []
History of large HOD moves (open->high):
> 25%-50% : 2 [46.2, 31.5]
> 50%-100% : 3 [63.9, 65.9, 57.5]
> 100%-200%: 0 []
> 200%+ : 0 []
History of gap up moves (close->open):
> 5%-10% : 1 [8.0]
> 10%-20% : 0 []
> 20%+ : 1 [34.3]
Given a gap up (n=2), statistically the stock closes:
> +10% or better: 50.0%
> +5% to +10% : 0.0%
> unch (+/- 5%) : 50.0%
> -5% to -10% : 0.0%
> -10% or worse : 0.0%
Given a +10% day (n=4), vs day 1 close, the 2nd day will open:
> Higher and close green: 0.0%
> Lower and close green : 25.0%
> Higher and close red : 50.0%
> Lower and close red : 25.0%
Holistic spikability score: 0.1875 / 10
CRDS - Crossroads Systems Inc. (NASDAQ)
Technology / Computer Hardware / Data Storage, 5 FT employees
6.68M cap, 1.23M shares outstanding, 584k float
0% / 13% / 3.6% insider / institution, short (prior month)
Cash (mrq) 1.71M, QUICK (mrq) 3.1, Cashflow (ttm) -8.3M
Catalyst - No “news”. On friday the company reported that they had to return some money that was lent to them to cover the costs of appealing patent ruling that went against them (if I read the form right). Otherwise a bunch of stock exchanged hands over the last month and nothing moved the price much.
Price Action - morning hump, some sideways action, then a bit of pickup staying above VWAP. Looks like a low volume chat pump after early positions were taken. Quick drop below VWAP 12:58 seems to support the lack of organic support. Tried to recapture and hold over VWAP at 2:15pm but failed by 3pm. Back into the gutter it goes. Some prior spikability but the odds show 2nd day as red by the end of the day.
BGC
max 5-year history for BGC
History of large positive moves intraday (open->close):
> 10%-25% : 5 [10.7, 22.2, 10.7, 10.9, 10.2]
> 25%-50% : 0 []
> 50%-100%: 0 []
> 100%+ : 0 []
History of large HOD moves (open->high):
> 25%-50% : 1 [26.7]
> 50%-100% : 0 []
> 100%-200%: 0 []
> 200%+ : 0 []
History of gap up moves (close->open):
> 5%-10% : 4 [8.3, 5.1, 6.5, 8.7]
> 10%-20% : 1 [10.2]
> 20%+ : 0 []
Given a gap up (n=5), statistically the stock closes:
> +10% or better: 0.0%
> +5% to +10% : 20.0%
> unch (+/- 5%) : 80.0%
> -5% to -10% : 0.0%
> -10% or worse : 0.0%
Given a +10% day (n=7), vs day 1 close, the 2nd day will open:
> Higher and close green: 14.3%
> Lower and close green : 57.1%
> Higher and close red : 0.0%
> Lower and close red : 28.6%
Holistic spikability score: 0.0 / 10
low spikability, running late, long term chart it's still sitting in a multi-month channel although it did break out of a multi-week channel. Also high priced so skipping to the next one.
ITEK
max 5-year history for ITEK
History of large positive moves intraday (open->close):
> 10%-25% : 5 [14.7, 14.8, 10.9, 11.7, 12.9]
> 25%-50% : 0 []
> 50%-100%: 1 [83.9]
> 100%+ : 0 []
History of large HOD moves (open->high):
> 25%-50% : 0 []
> 50%-100% : 0 []
> 100%-200%: 1 [101.3]
> 200%+ : 0 []
History of gap up moves (close->open):
> 5%-10% : 8 [9.4, 5.1, 5.1, 7.2, 5.7, 9.1, 5.7, 5.6]
> 10%-20% : 2 [18.1, 13.5]
> 20%+ : 1 [59.1]
Given a gap up (n=11), statistically the stock closes:
> +10% or better: 9.1%
> +5% to +10% : 0.0%
> unch (+/- 5%) : 63.6%
> -5% to -10% : 27.3%
> -10% or worse : 0.0%
Given a +10% day (n=9), vs day 1 close, the 2nd day will open:
> Higher and close green: 11.1%
> Lower and close green : 0.0%
> Higher and close red : 66.7%
> Lower and close red : 22.2%
Holistic spikability score: 1.8125 / 10
Long term crow like a mo-fo. Not even going to bother further.
SHLD
max 5-year history for SHLD
History of large positive moves intraday (open->close):
> 10%-25% : 13 [12.7, 12.3, 14.6, 10.6, 23.0, 12.2, 10.4, 11.8, 11.3, 13.4, 11.5, 19.2, 10.5]
> 25%-50% : 0 []
> 50%-100%: 0 []
> 100%+ : 0 []
History of large HOD moves (open->high):
> 25%-50% : 1 [30.7]
> 50%-100% : 0 []
> 100%-200%: 0 []
> 200%+ : 0 []
History of gap up moves (close->open):
> 5%-10% : 8 [6.2, 6.6, 6.5, 9.9, 5.6, 5.2, 6.1, 5.4]
> 10%-20% : 2 [10.8, 13.6]
> 20%+ : 2 [20.9, 39.2]
Given a gap up (n=12), statistically the stock closes:
> +10% or better: 0.0%
> +5% to +10% : 16.7%
> unch (+/- 5%) : 41.7%
> -5% to -10% : 33.3%
> -10% or worse : 8.3%
Given a +10% day (n=17), vs day 1 close, the 2nd day will open:
> Higher and close green: 23.5%
> Lower and close green : 47.1%
> Higher and close red : 0.0%
> Lower and close red : 29.4%
Holistic spikability score: 0.0 / 10
Crap spikability historical numbers and crap volume given the float, skipping.
Been far too long since I last did this, hopefully tomorrow goes faster.
Want more? Check out the Table of Contents page.
Join now or log in to leave a comment