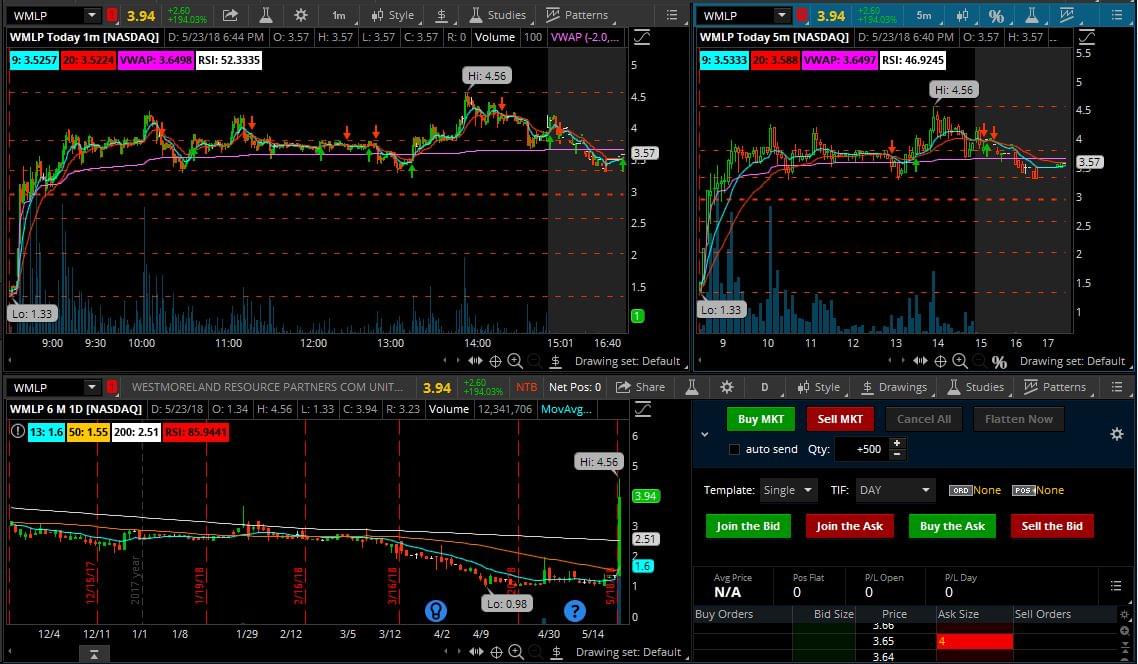
If anyone wants to share ideas on TOS indicators or could use some help, send me a message or comment below. The attached image is my current setup.
I have the 1min and 5min with the 9EMA, 20EMA, VWAP, and RSI. The RSI will change colors based on overbought or oversold. Also, I have the fib retracement levels automatically adjusting per second (these are the red, dash lines).
For the Daily, I have the 13EMA, 50SMA, 200SMA, and RSI. The RSI changes colors as well.
Whats the statistical edge of this indicator versus RSI or MA cross?
@anderton88 The Daily chart with the EMA and the SMAs shows me if the price action will hit any resistance and/or support. I use this in the morning to see the stock is even worth putting on the watchlist.
@anderton88 After that, I use the 1min and the 5min for intraday plays. The 1min is used to base my entry and the 5 min is too see when to get out. The 5min helps with eliminating all the 1min noise. I use the VWAP to see if I should be long or short depending on if the price action is above or below. Last, the 9EMA and the 20EMA is for the MA cross over. You'll see arrows on the chart when the EMAs cross.
Join now or log in to leave a comment