Hey guys I've looking to $AMDA for already 2 months. This stock has hit his bottom already. The company on November 10th they submitted a 24-Month Clinical Data to FDA for Clearance of Composite Interbody Spinal Device. However if you look at the graph they're forming a triangle pattern. I will keep my eyes on it because it can have a good potential going back to the 0.40s again or more. Thanks for reading this and I will like to hear opinions in this stock. Feel free to comment on it.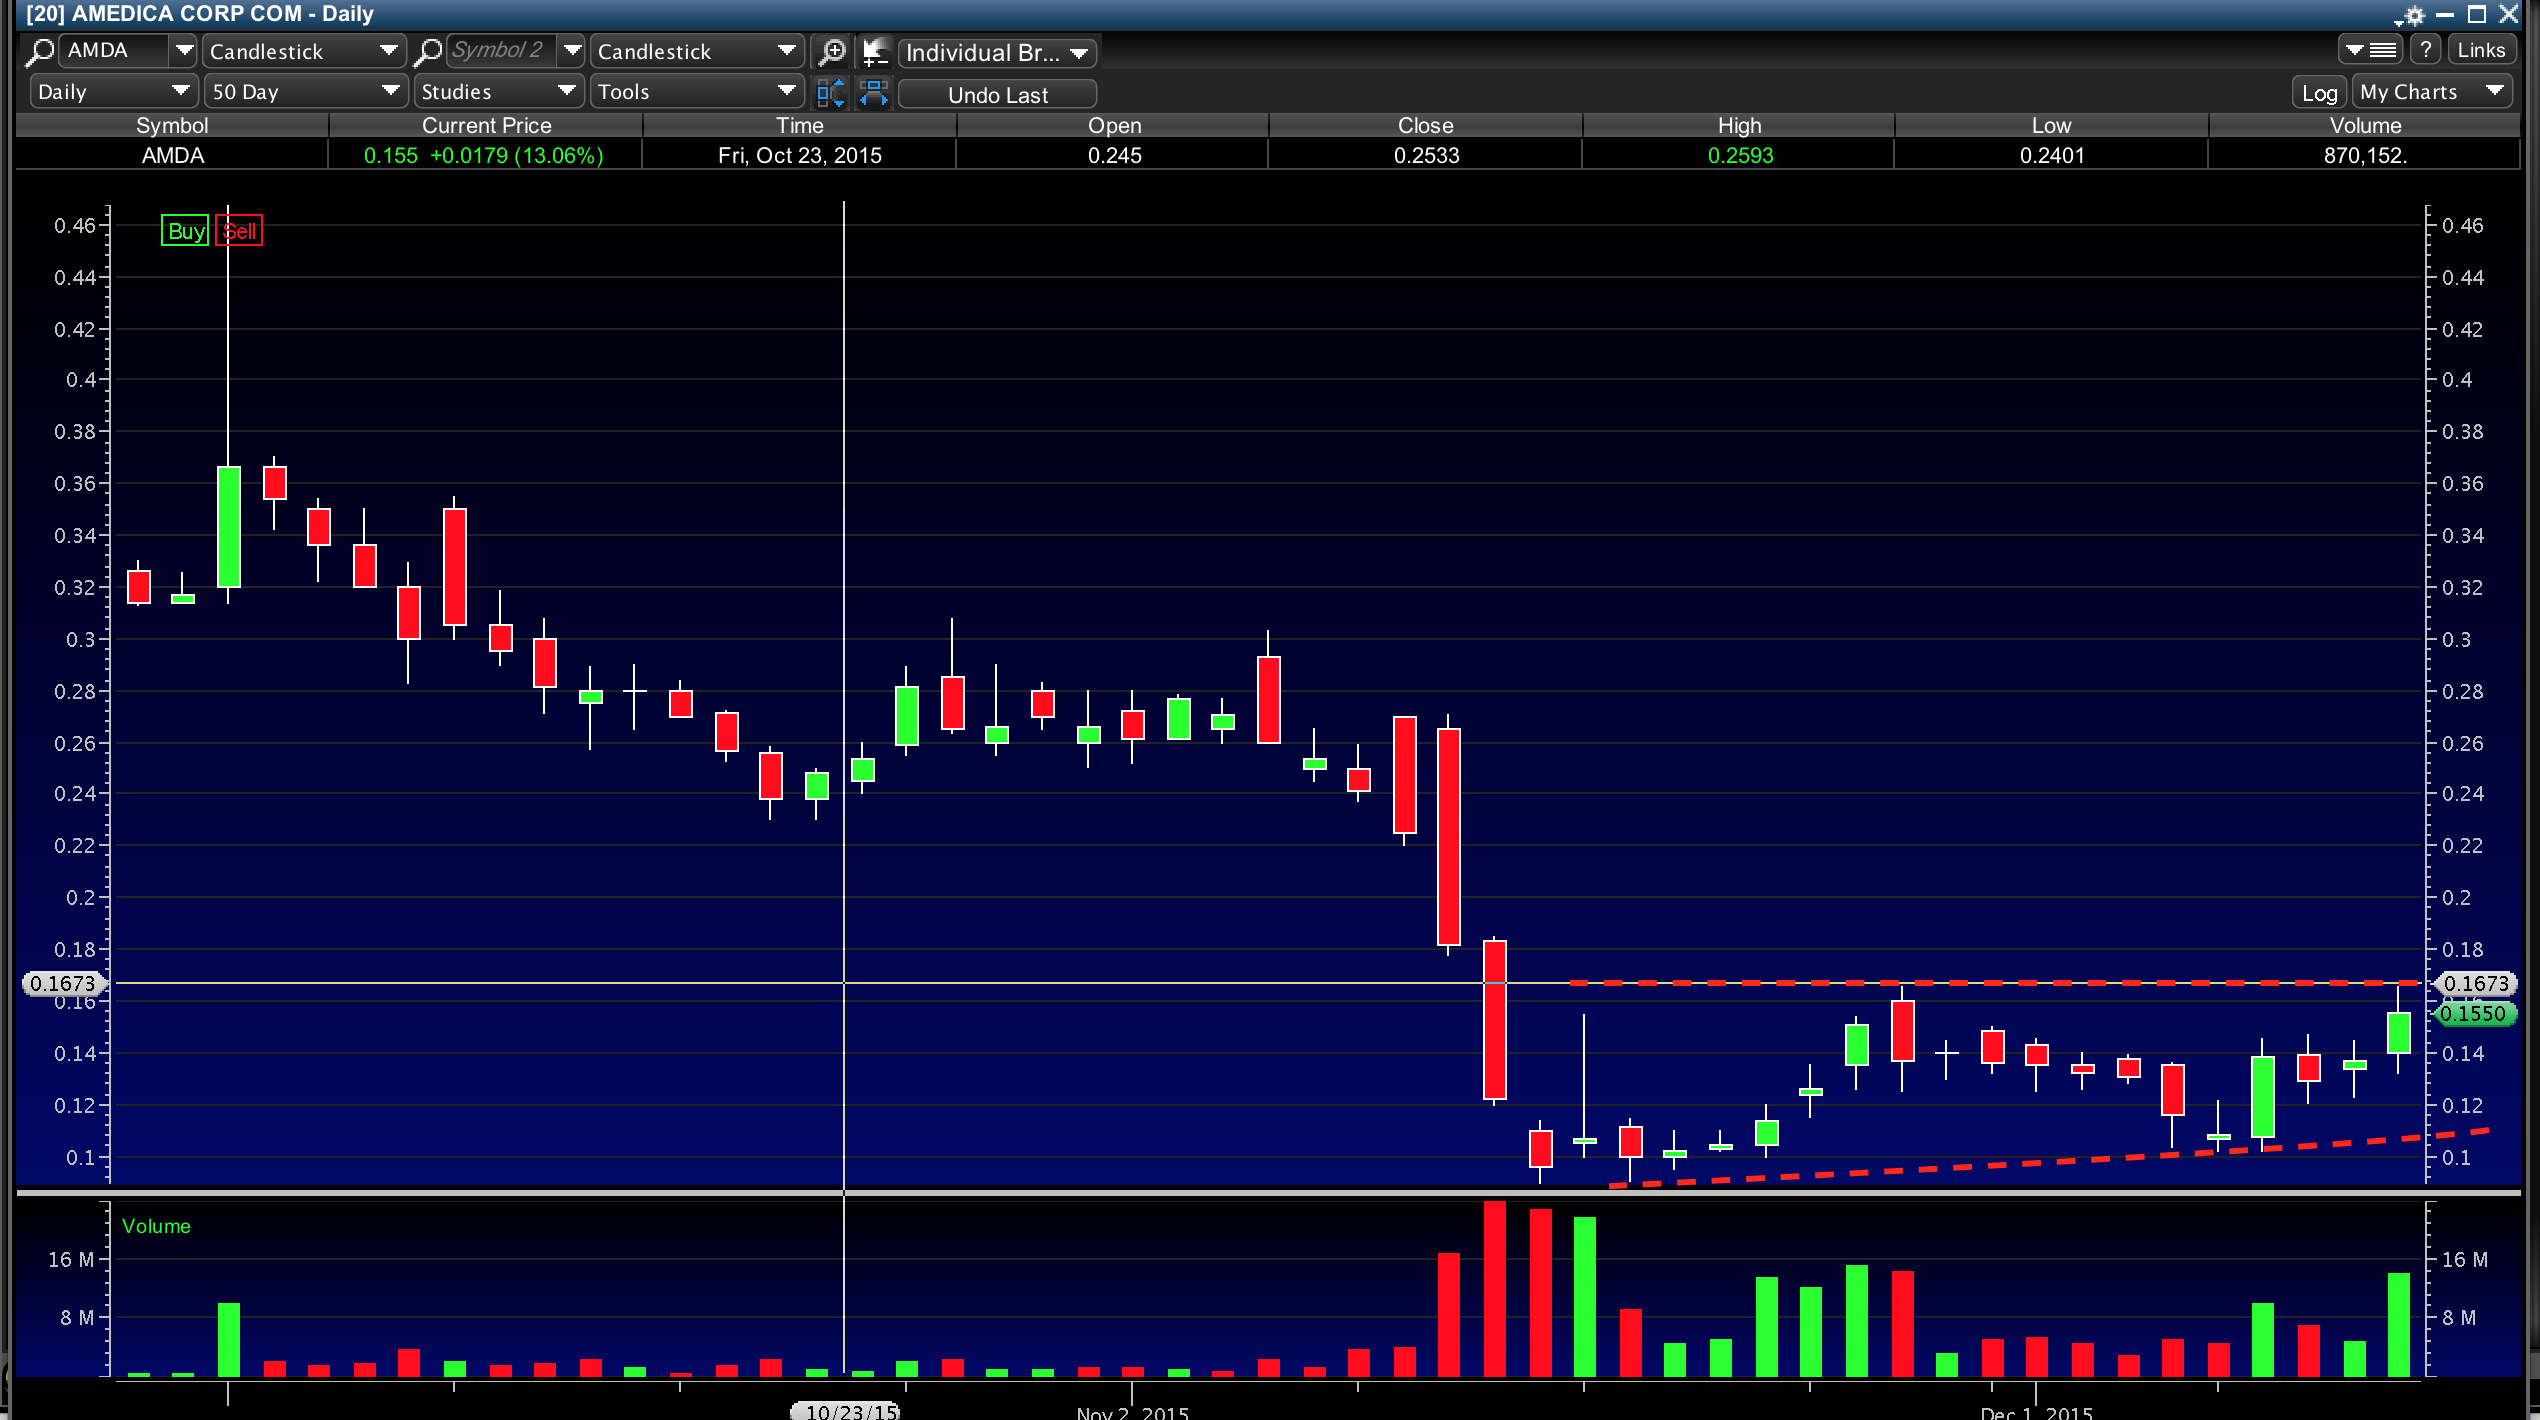
Posted Dec 12, 15 11:19 AMbyrenekite13
Tickers
AMDA
I'll be looking to reenter EOW
@IndigoChild yeah that might happen, but as long doesn't go lower than .12 the pattern will still on. just lets keep an eyes in it its should spike anyth
anytime soon, he's resistances level still on the .16s if it gets to break it should spike to the .20s
guys this pattern Dekmar uses Fous4 uses and many other investors. This is probably the key for good gains.(size position influence too) @thederektaylor @IndigoChild
Join now or log in to leave a comment