So is my breakdown of CLSN today,
Found this stock early premarket, around 8:15 ET, with one of my scans on TOS (thanks Arick Russel). When i first took a look at the chart it looked like it could be a gap and crap. It had that initial spike up right up to around what the high was on Reverse Split day. then it quickly came back down $.40-.50. Buuttt I kept an eye on it anyways. Pretty soon it started moving back up towards its reverse split day high which for me was a very bullish signal with all the reverse split mania we had a few months ago.
But hold on lets look at some metrics... Nanocap, Check, Low Float, Check, Catalyst(positive CANCER trial), Check...also not to mention its a recent reverse split which was a hot play a few months ago. This stock had pretty much everything it takes to make a nice run in the morning.
I did not play this stock, thought Id mention, But i did watch its every move from 8:15 until about 11.
#1,2,3,4 are linked with the arrows on the chart
#1. First buy signal for me was the break and test of the reverse split day high which was 3.46. this was in premarket. I really liked how it broke and retested 3.46 as SUPPORT, 3.50 seems like a great entry premarket to me and it never got back to that level again. you could have sold anytime into the open spike for a good profit.
#2. Second buy signal.. This play is more speculative than #1. After the spike to $4.60 their was a fast breakdown to $3.85. really fast with some nasty deathdrops for longs. Thats why i consider this so speculative seeing how quick this stock can dump, anyways the breakdown to 3.85 held once, then again to form a bit of a double bottom. Also during this bottoming I noticed a couple Larger Short positions being taken, 30-40k sellers on level2 right at $4.00. So my mentality with this was that if those guys could get absorbed quickly and break above $4 This thing might make another run, volume was crazy high, early shorts.. holding support. ok decent speculative Buy. it did end up spiking and it made it all the way up to long term resistance on the 5year daily. I would have sold around 4.40-4.50 if i was in
#3. First Short Signal.. to me this seems pretty simple but was a bit aggressive considering the float and news ect. $4.45ish was support earlier in the day so when you see it retest that 4.45 level and use it as resistance to me that would have been a good entry to short. sideways price action, fading volume... resistance holding. you get the picture. finding shares to short would have most likely been impossible
#4. Second short signal..so CSLN somehow traded its way all the way back down to the $3.85 level that it used as support in the morning. it held right against it for like 15 minutes and broke down through it. to me the chart shows alot of selling pressure the way it held right against that level. good technical breakdown intraday with low volume.
so yeah hope you guys like the breakdown thats how i read the stock but if you see things from a different angle let me know i would love to hear some different viewpoints 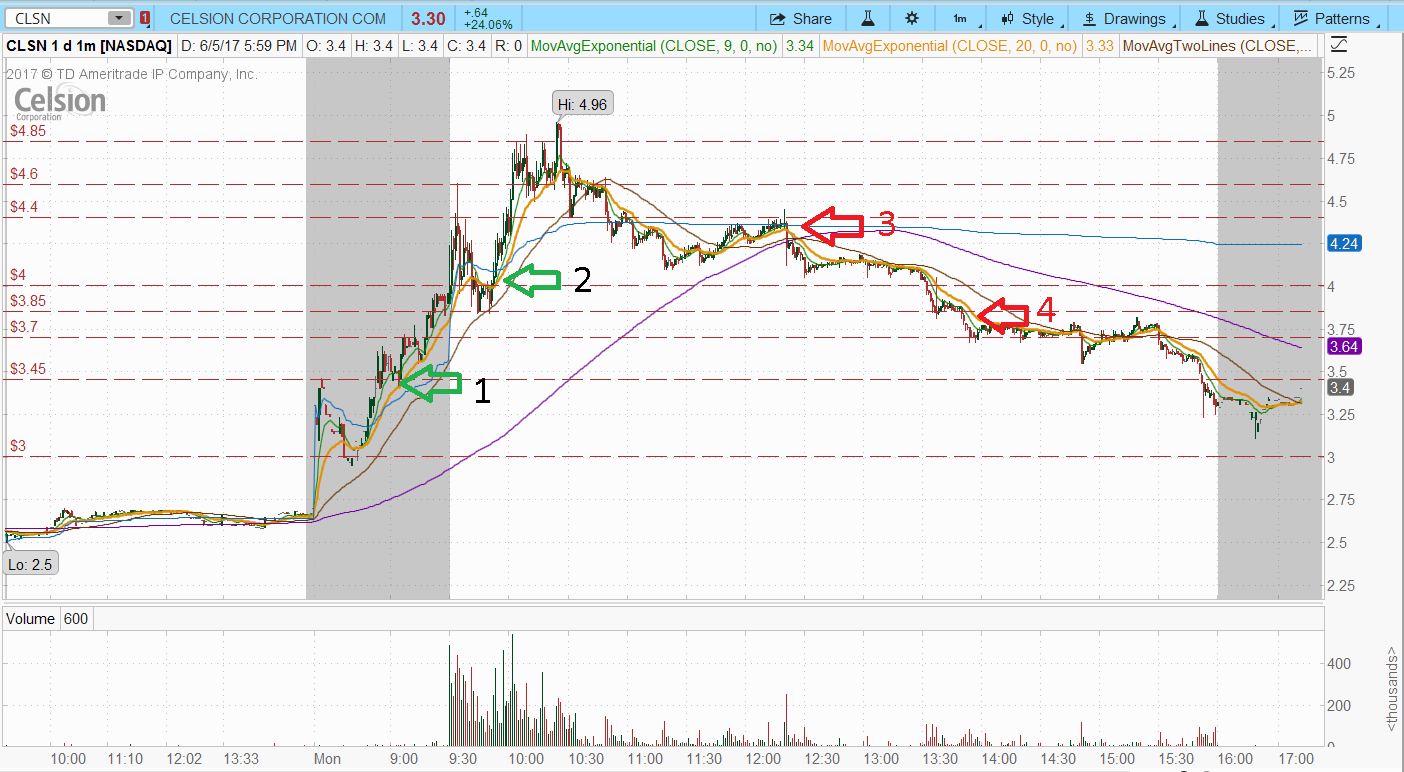
Join now or log in to leave a comment