FNCX popped up on my screener 2 May 2017 @ .70. Jumped up .20 3 May unfortunately, I didn't get a good entry. I was watching stocks on Tim's watchlist first. By the time I circled back around to my new additions from my screener I missed the jump. FNCX went down 4 May, and I saw this as the first red day pattern...a short trade signal. I dropped it from my watchlist and moved on to other tickers, but it's back on my list for a closer look.
When the stock popped up on my screener 2 May I added channel lines to the daily chart to help with key b/o and b/d levels.
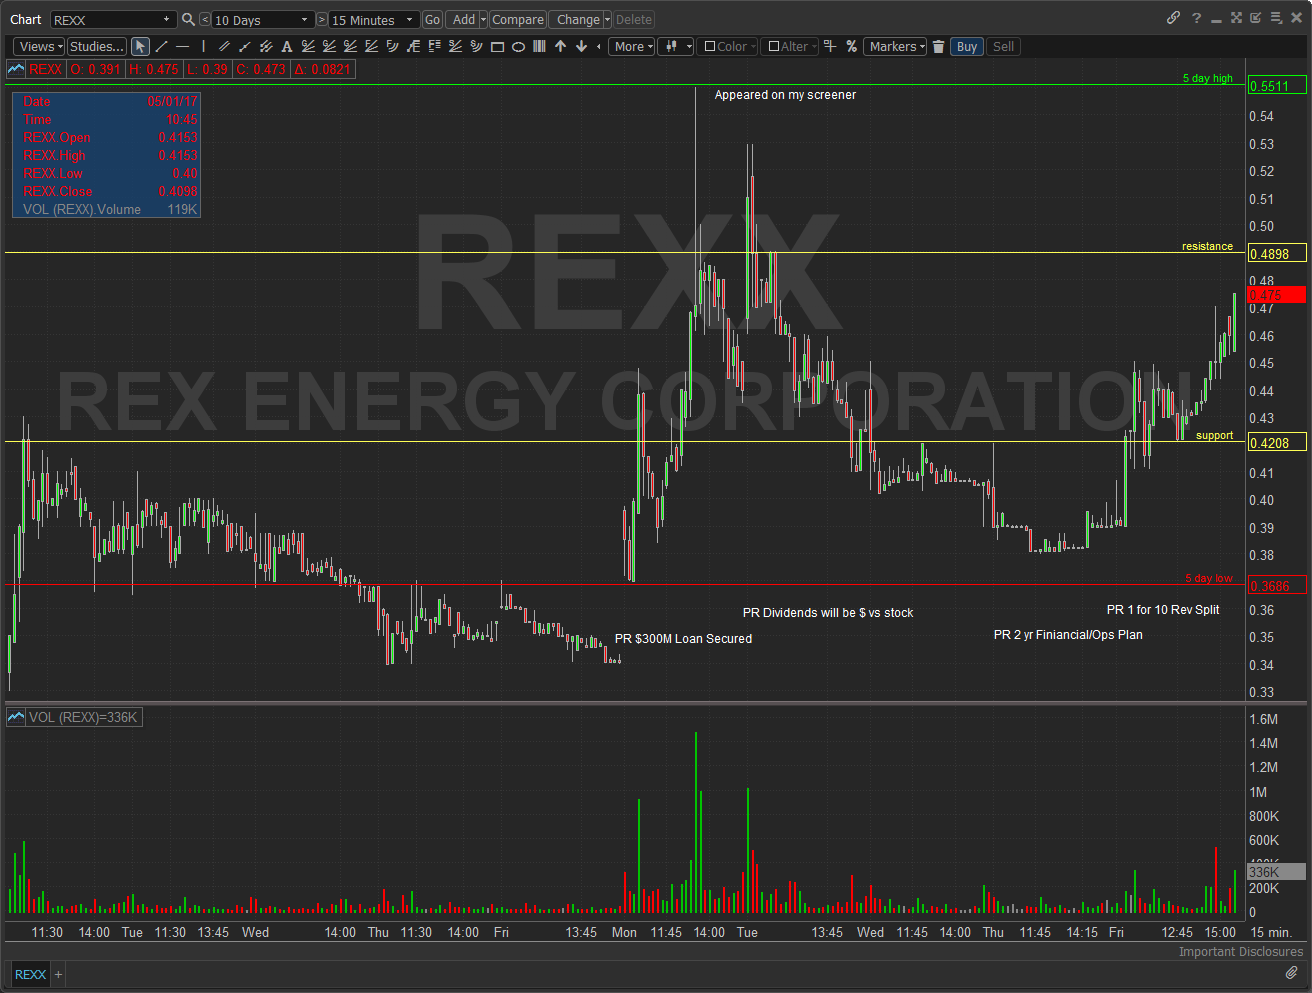
REXX is the second stock I'll be stalking over the next two weeks. They secured $300M via a Loan with an investment group (PR 1 May), Switched dividend pmts from stock to cash (PR 2 May), Published a 2yr financial & operations plan (PR 4 May), and then a 1 for 10 reverse stock split (PR 5 May). Over the last 5 trading days it traded between 0.36 -.55. Overall it seems that REXX is looking to consolidate their stock vs. long term dilution. It also chose to partner with financial group vs an ATM stock financing ... doesn't mean they won't do it as the value of the stock increases. After the reverse split ATM close 12 May it will be traded on the NASDAQ beginning 17 May. I may take a small position between next week, but I don't plan to hold through the transition. I'm very interested to see how it reacts 17 May.
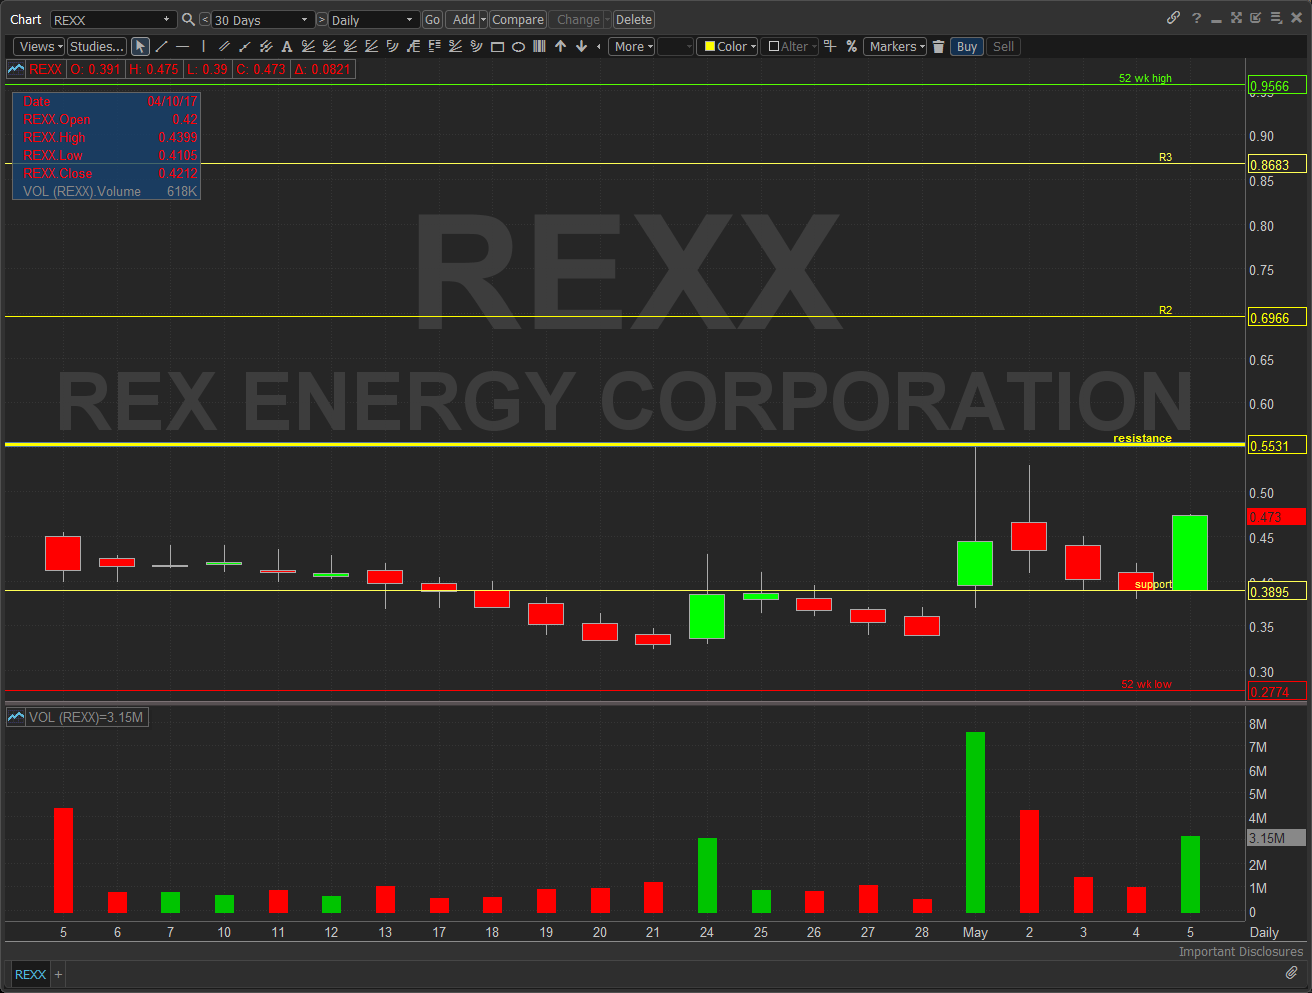
Here is a 30d daily chart with some resistance marks to help me as the price moves higher.


What's your source for the FNCX 1:10 reverse split news - can't find it anywhere.
http://www.nasdaq.com/press-release/rex-energy-announces-oneforten-reverse-stock-split-20170505-00920
REXX is the 10-1 split not FNCX
Thx for the clarification.
Join now or log in to leave a comment