Will fill in chart patterns here that I see repeating over and over again...This is only one but I'll add more later.
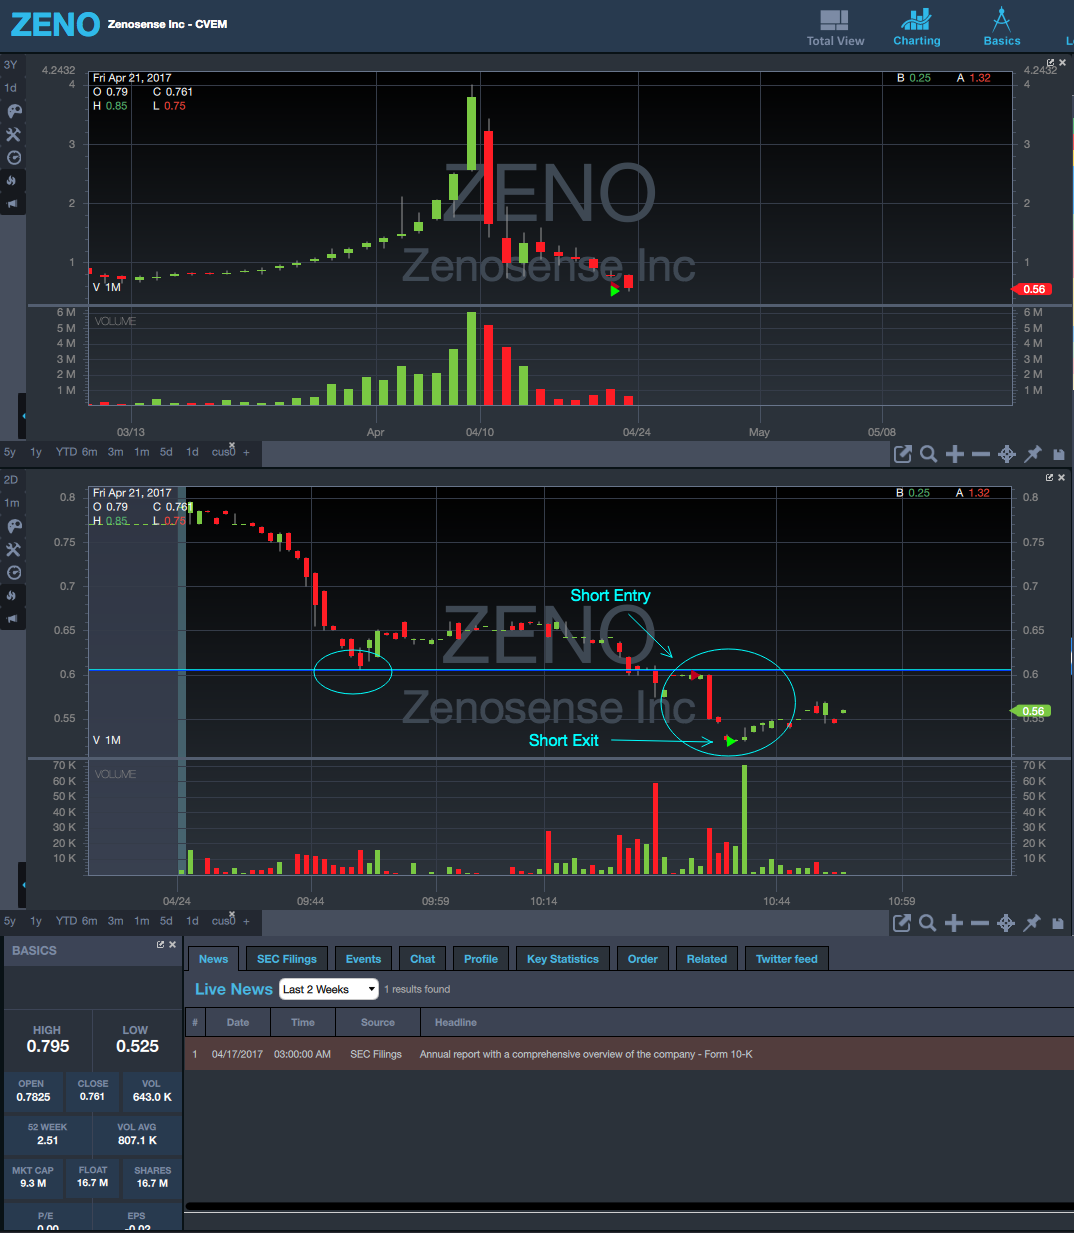
$ZENO is on its way down... there's no surprise there. But this type of pattern where the stock drops, then bounces almost like in an oval shape and then hits support a second time only to crack below it is something that I've seen time and time again. I paper traded this pattern today (partially because it's not worth it for me since it's already so low priced) but you can see even with a 1000 shares short, I still profited in paper off of it. I'm going to keep this list here so I can remember all the common charts that repeat that I'm seeing often. This is one of them:
From 4/24/17
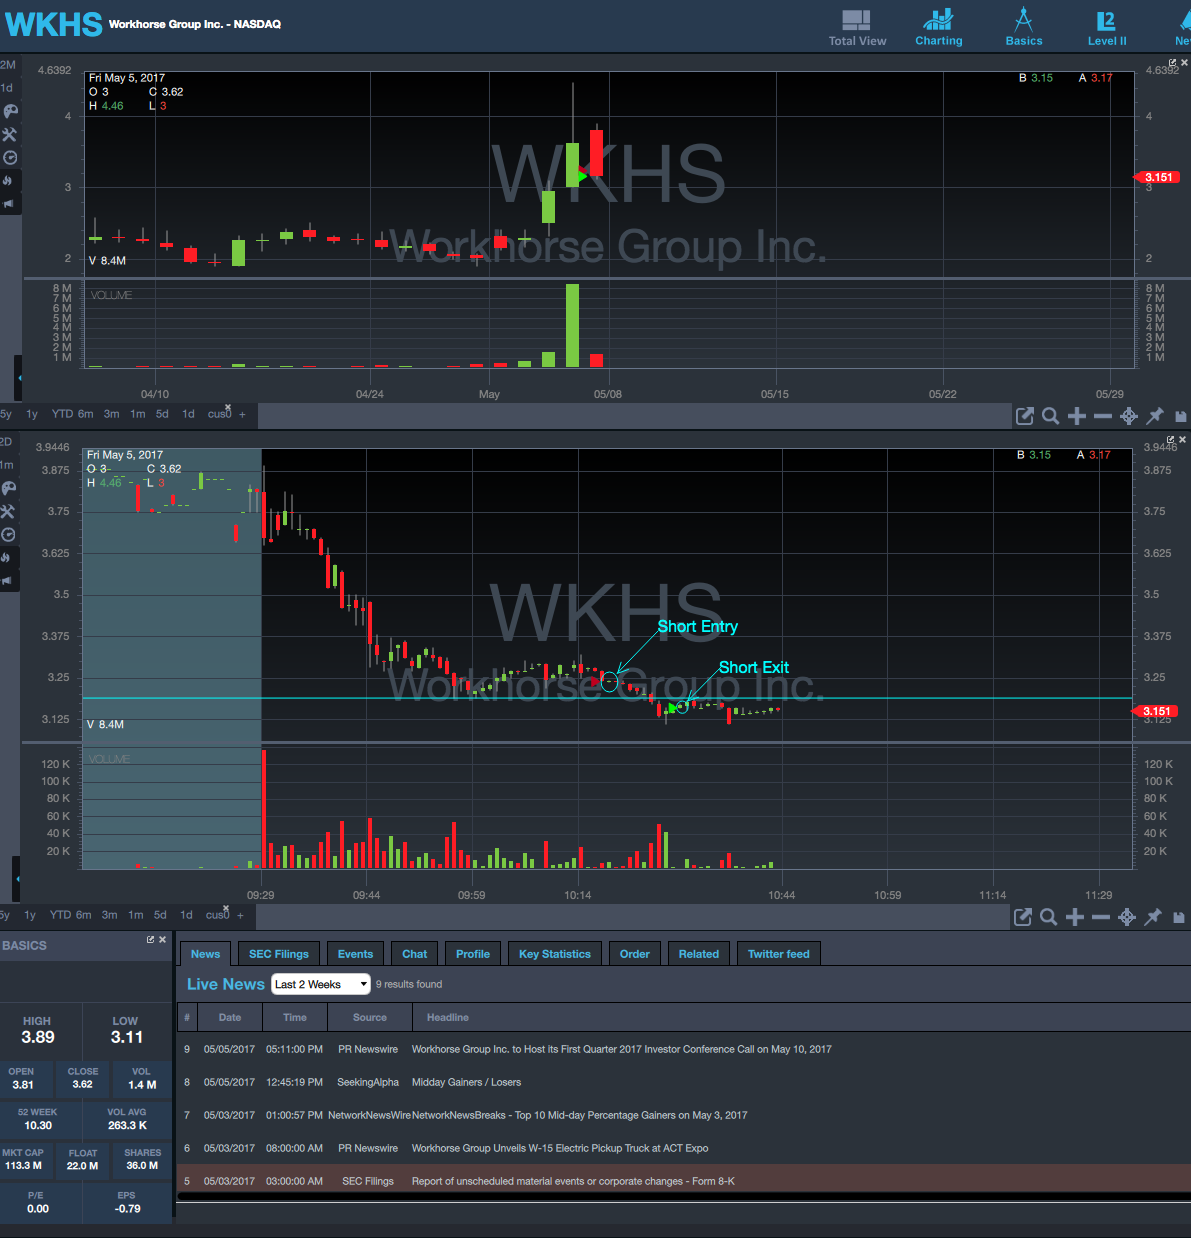
Updating to include $WKHS from today. Although not a pump that I'm aware of like $ZENO, it shares a similar pattern to the above. I paper shorted this due to my account size being under margin account size. Profited bout $70ish on only 1k in.
A pattern that has repeated itself and one that I keep an eye out for regardless of whether or not it's a pump.
Here is the similar pattern from $WKHS:
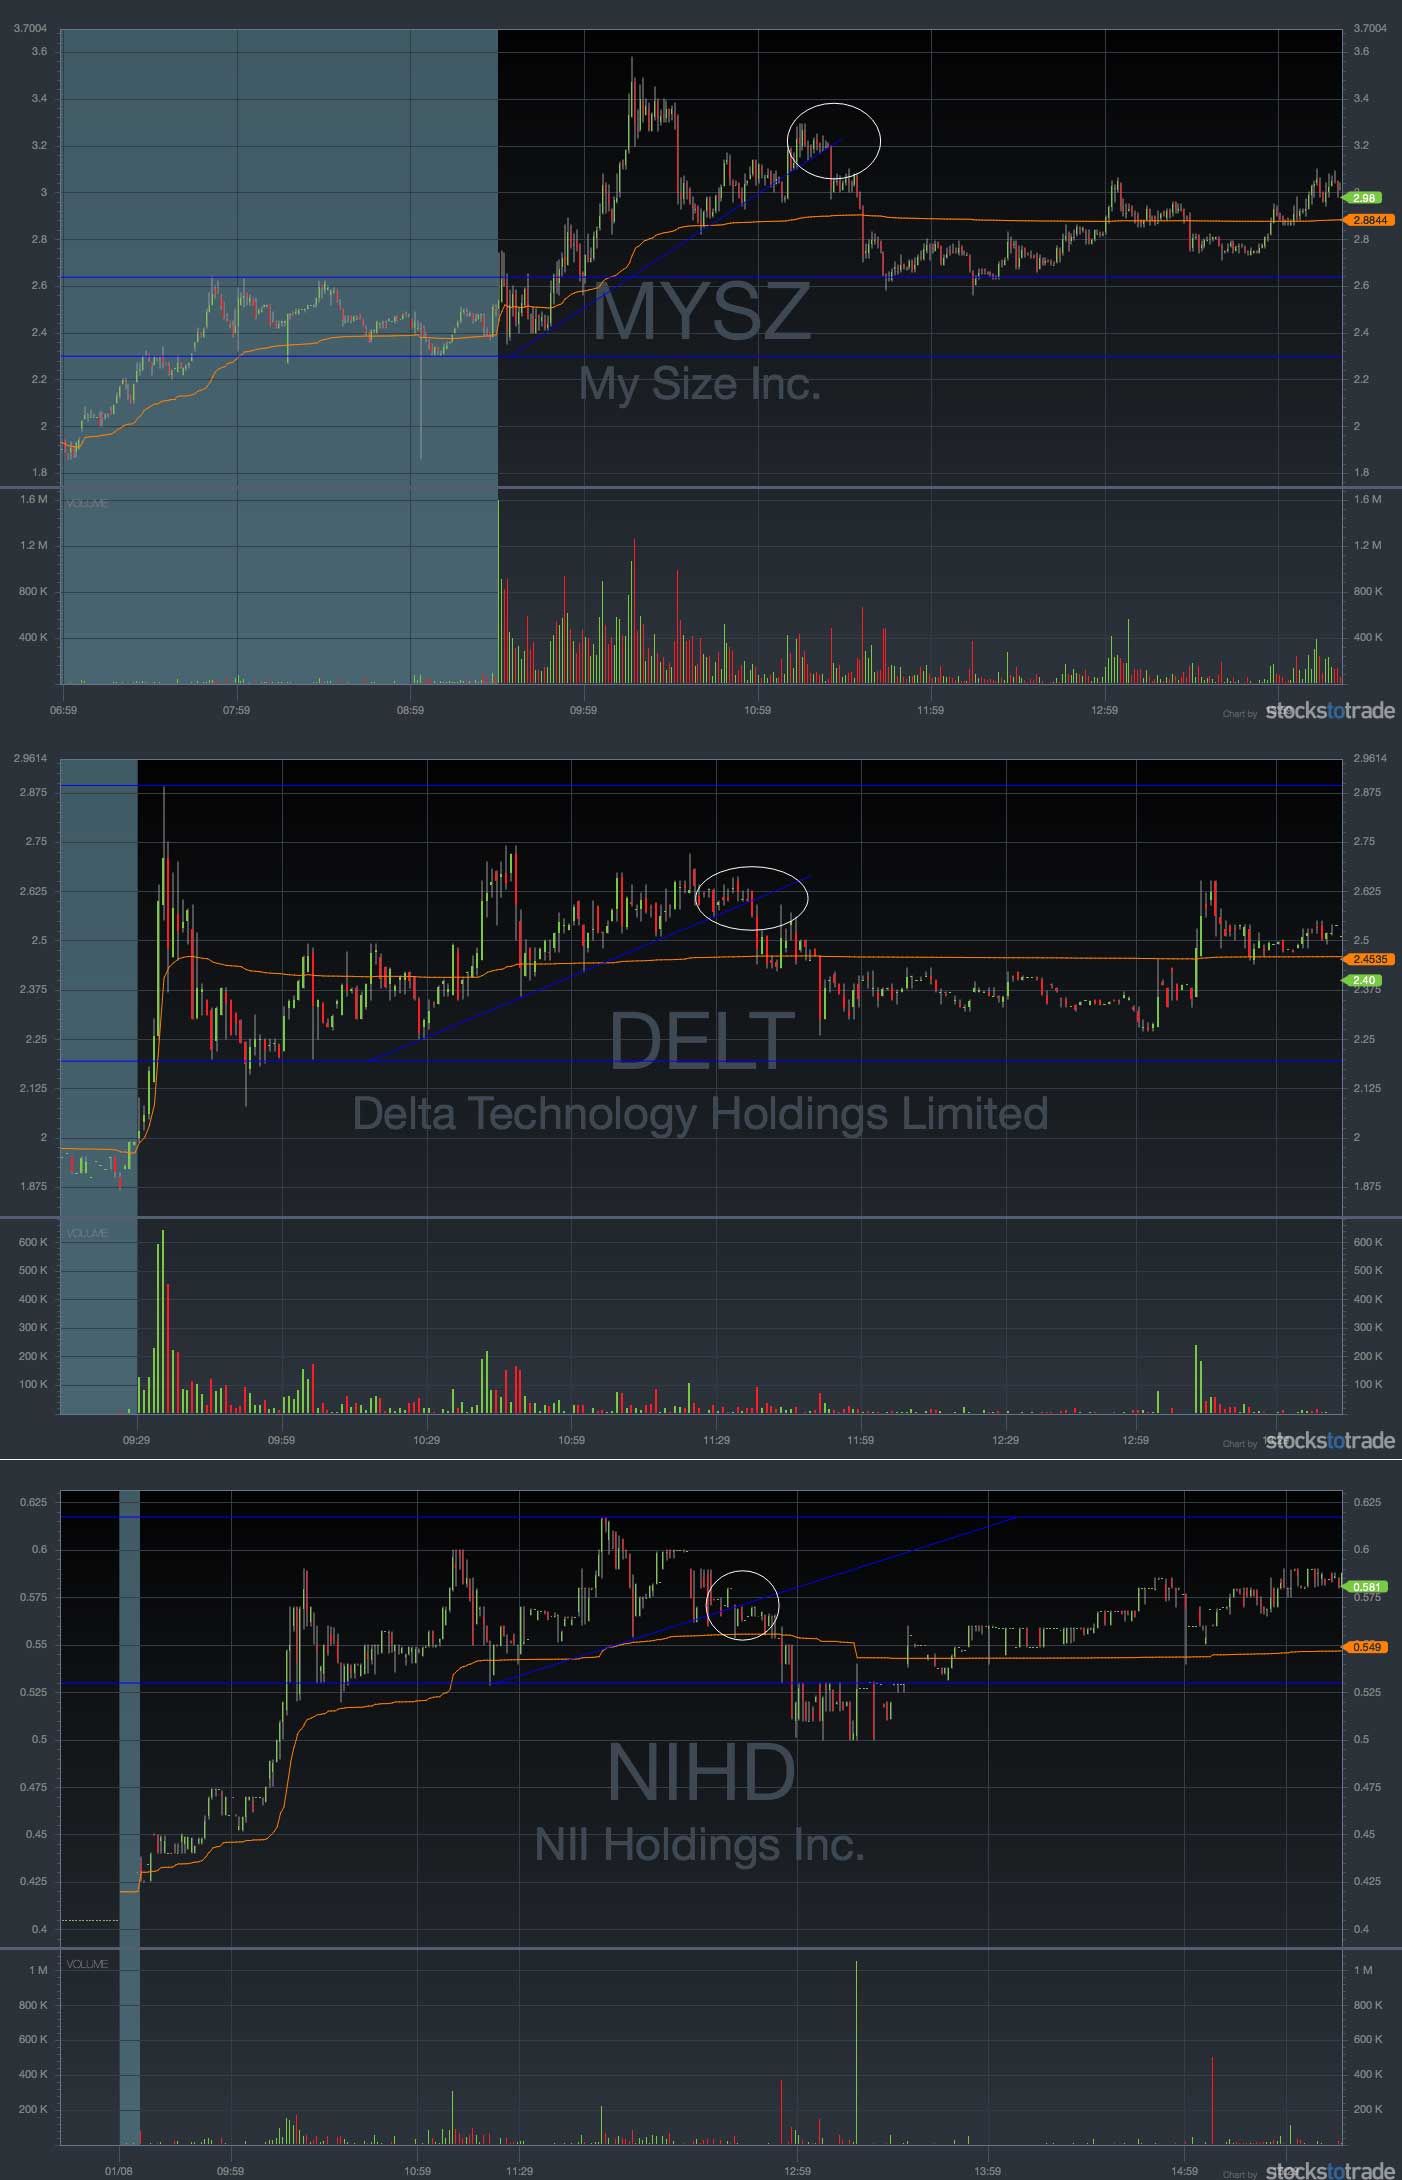
Three charts in the same day with similar patterns - $MYSZ $DELT $NIHD From 1/08/17
Check out the short op just after these charts crack their trendlines:
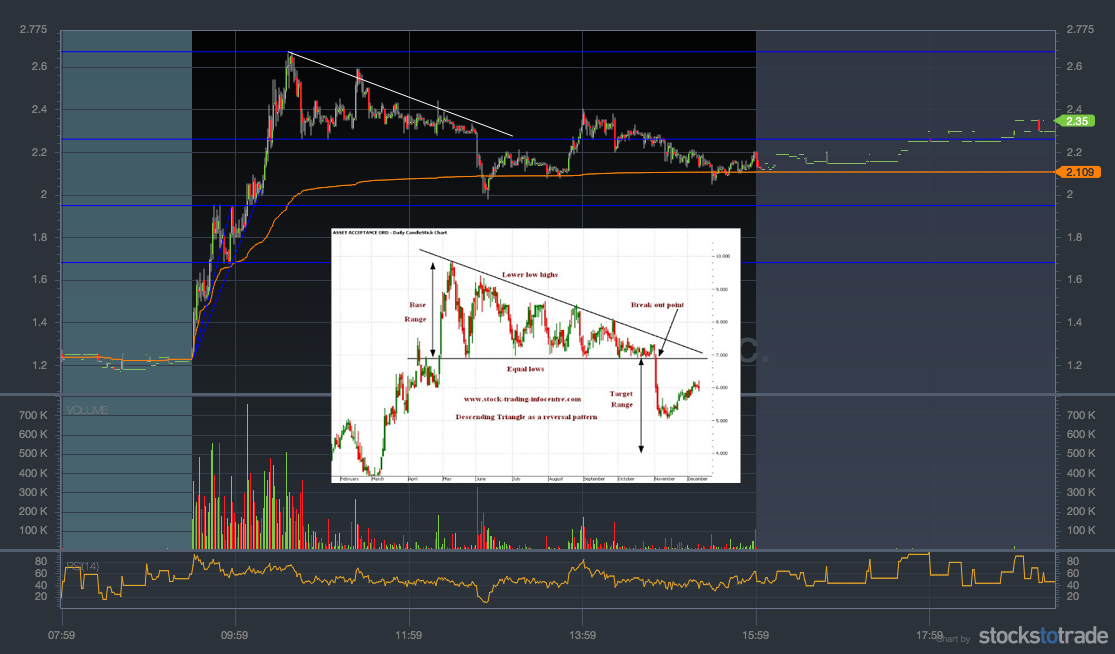
$VTVT (Below) 4.18.18 Beautiful Descending Triangle crack
Yes - No 6 pattern =)
@Torkers I had thought the #6 was the 'long kiss goodnight' pattern, no?
Good eye.
Join now or log in to leave a comment