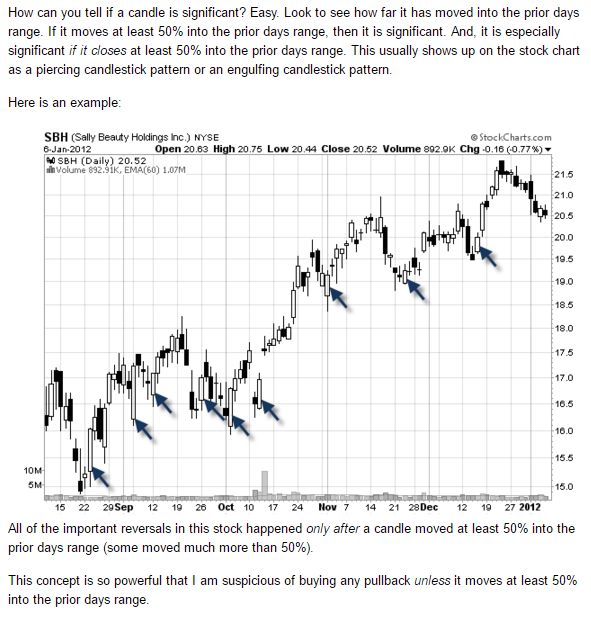
I came across this silly rule today while researching overnight swing trades because I am out of PDTs. Not that I need to be forcing trades, just looking for some reading material on overnight trades. I came across this weird rule that I can only find on this one website, I look up the 50% rule elsewhere and it never means what this guy is writing about. I called the ToS guys and asked if there was a way to scan to compare the day before candlestick's "main body" to the current day's "main body" 15 minutes before close. Then wanted to kinda predict the next days price action as this guy alludes to ahead. He didn't even know what the "main body" of the candlestick was. I gotta say, in the hour I've been looking flippantly through various month long charts, it mostly checks out. What do you think, bullshit....or not? Thanks for looking at the quackery and giving me your opinion:

It may be interesting to track a large sample size of at least 50 trades and see if there's an edge present with that idea. When a stock makes a big move, there can be continuation with follow through momentum the next day. But it'd likely be safe to trade other variables as well in conjunction with this one.
This could be really nice in conjunction with Fibonacci Retracements... Still need to research the 50% rule for more clarity, I don't quite get it yet.
I don't understand fibbonacci yet, but I've been doing some charting on this 50% rule with about 10 different criteria to come up with a plan of action. It mas be profitable and predictable. @rashaan7 you got any fib info?
I've been watching YouTube videos on fib retracements and after like 5 or 6 it just kinda clicked. Jason Stapleton explains it very well though if you watch a few of his videos!
Join now or log in to leave a comment