This was my first two weeks trading since 2013 when I withdrew my money from my account to help me avoid any more losses. During this time off, I wanted to continue educating myself on the stock market and I feel that it's beginning to pay off. I am no where near perfect yet, but I have made two trades that have lead me to successful profits. I started this week with just $130 in my account and have just added another $500 over the weekend. I don't plan on adding any more money right now, so I am forcing myself to only play the best stocks. This will help me from forcing plays that are not there and to keep myself from over trading. Tim mentioned several times throughout the week that the market has changed, and that there really are no good plays out there. Watching some of these morning spikes fail, I knew that the market changed before Tim posted his alerts, and I felt more confident in my trading as he confirmed my thoughts about the market.
The week of 6-11 was a successful week and I am glad that my learnings are working. After watching Tim's Penny Stocking Part DEUX, and Penny Stocking: Penny stock Trading Secrets, I feel much more equipped and educated with my buy/sell decisions.
On 6-1 I bought $NUGN after Tim called out that it was a Pump-n-Dump. After watching Penny Stocking Part Deux, I understood the principle and theory behind this type of chart pattern and the risk that I was getting myself into. With my small account knowing that I can't short yet or anytime soon, I took a small position size with a mental loss of $0.10. After carefully reviewing the intra-day chart pattern I felt that this was a safe position as the stock did nothing by continue to stair steep. I held on to this stock for about a week before I sold after I noticed intra-day that the stock was acting funny. You can see the two charts below of the Daily and Intra-day to better understand why I bought this when I did and why I sold it. 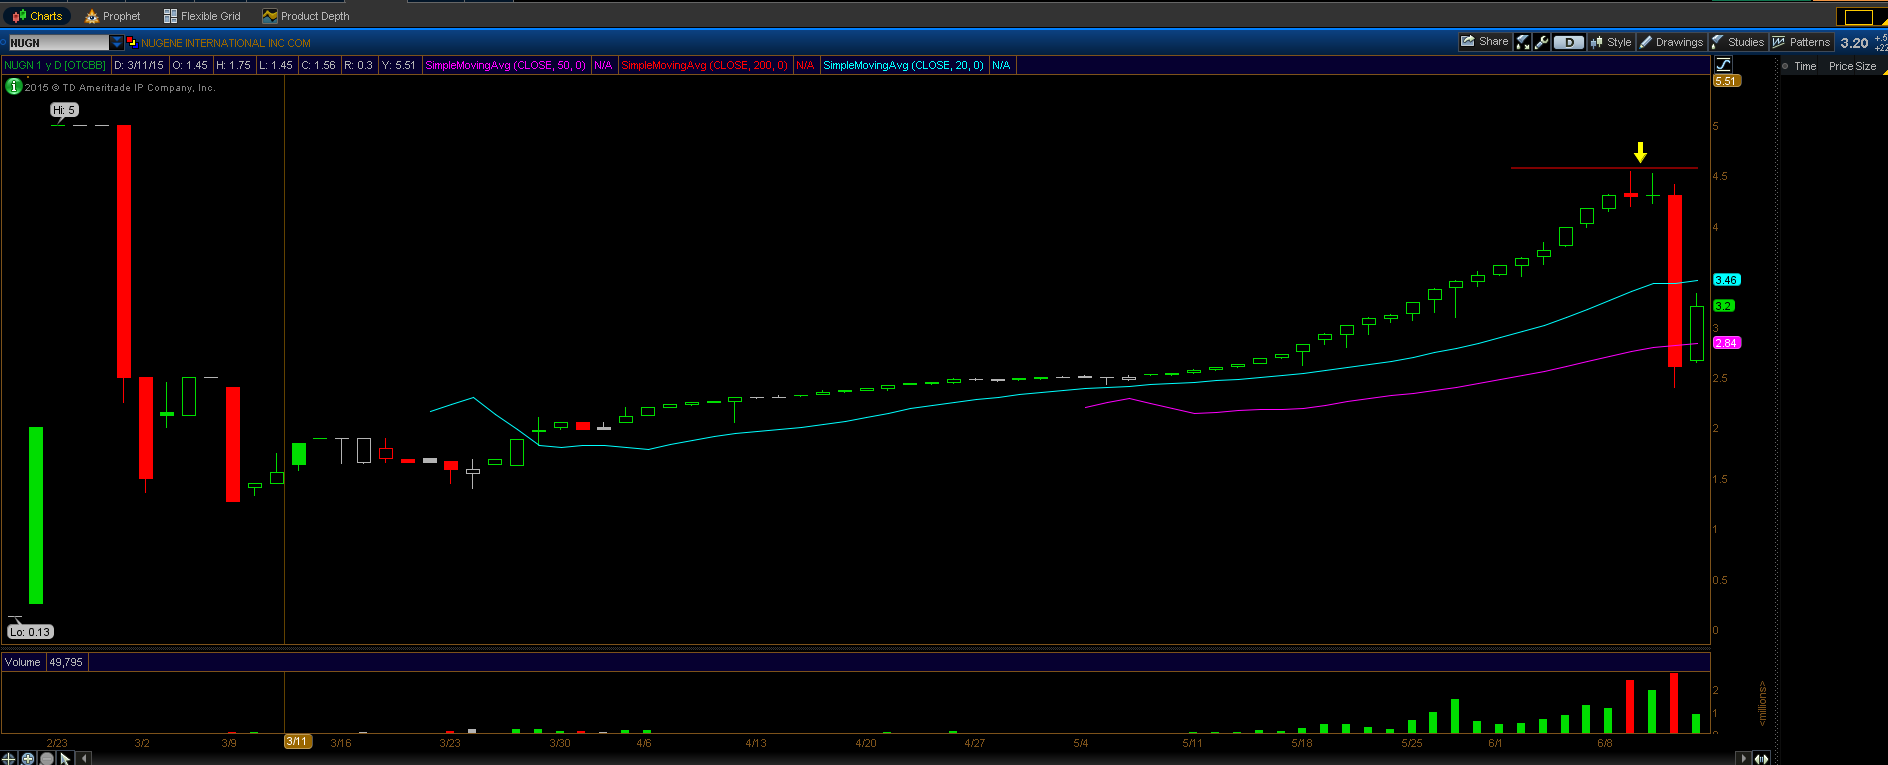
As you can see on the daily that the stock did not have 1-red day once the stock began to make its climb. This was very bullish esp. knowing that the stock was being pumped. I was hoping for a spike straight up before the dump but it did not happen which to me was okay because it's the principle of when to buy and when to sell. As you can see the yellow arrow pointing down shows a "double-top" with two doji candlesticks. This is a sign that the run up is almost over and the dump is imminent. So I sold my position with a small gain.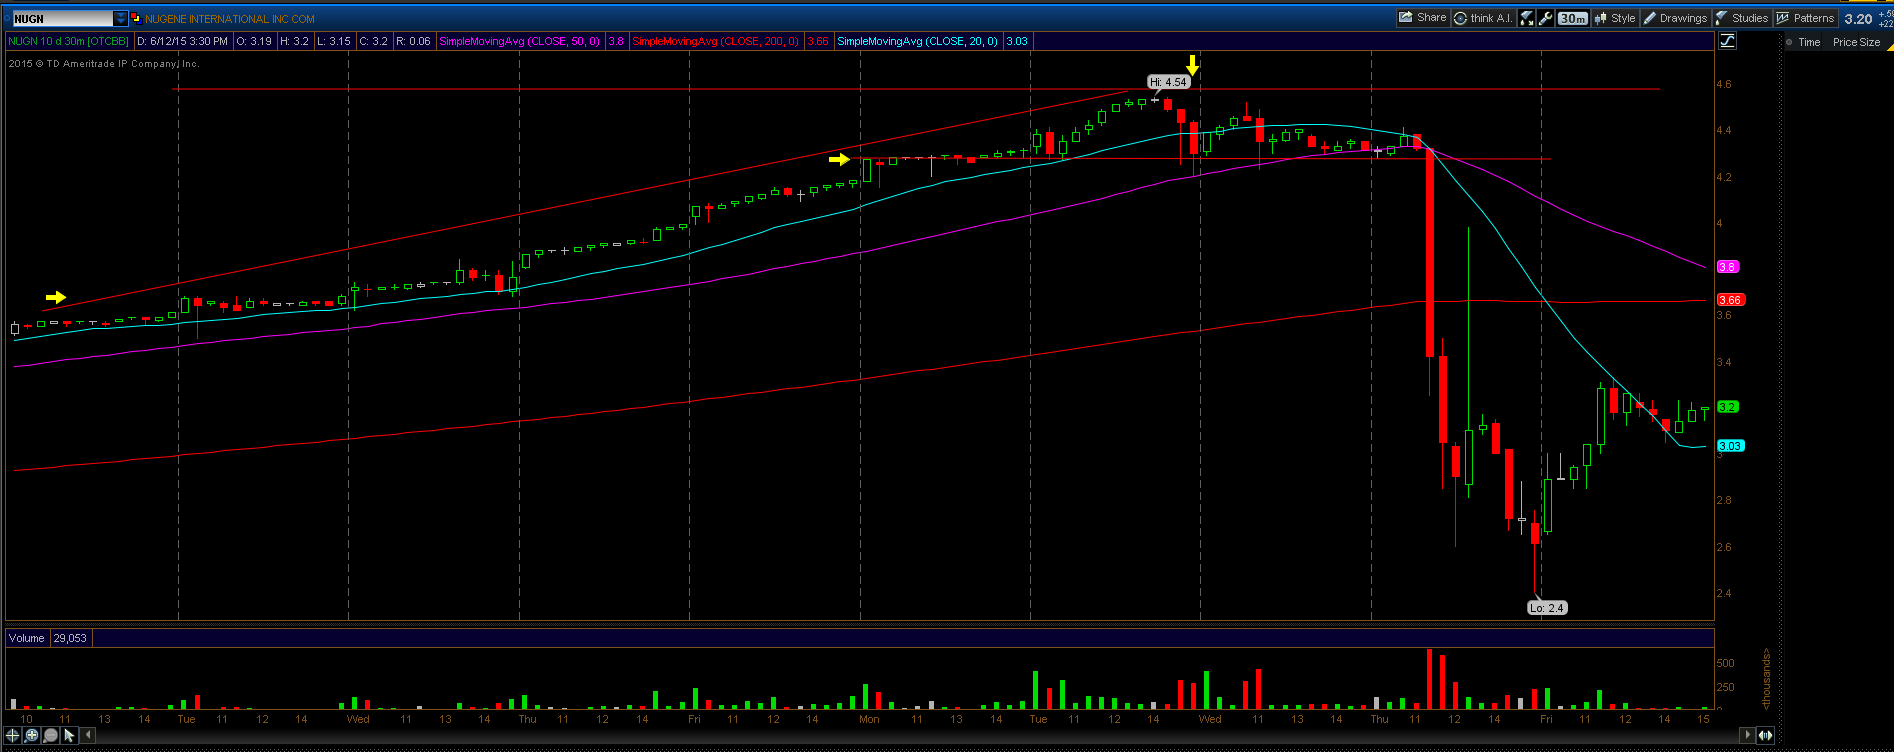
The indra-day chart you can see a very nice stair step climb up every day closing green. Not one red day showed up. Then on 6/9 you see the top where the chart didn't stair climb that day but instead started arching. This also happened to be the exact top of this stock and I knew that the run was over. I sold on the first red candle stick that I saw on 6/9 and glad I did. As you can see, the second yellow arrow you notice the trend line that acts as resistance has turned into support and then off the cliff $NUGN fell. This was so predictable like Tim mentions is his DVD's and so easy to spot the run and the fall.
The next stock I played was $ESI. This was a stock that kept popping up in my scanner that I created after watching Tim's DVD's. When I looked at it the first time, it had spiked and then started to pull back to form a base. When looking at the Daily, you can see a "Cup-n-handle" patter beginning to form. This is a bullish pattern so I kept my eye on this one waiting for the breakout. Then on 6/11 $ESI had a green day, and was making great price action intra-day.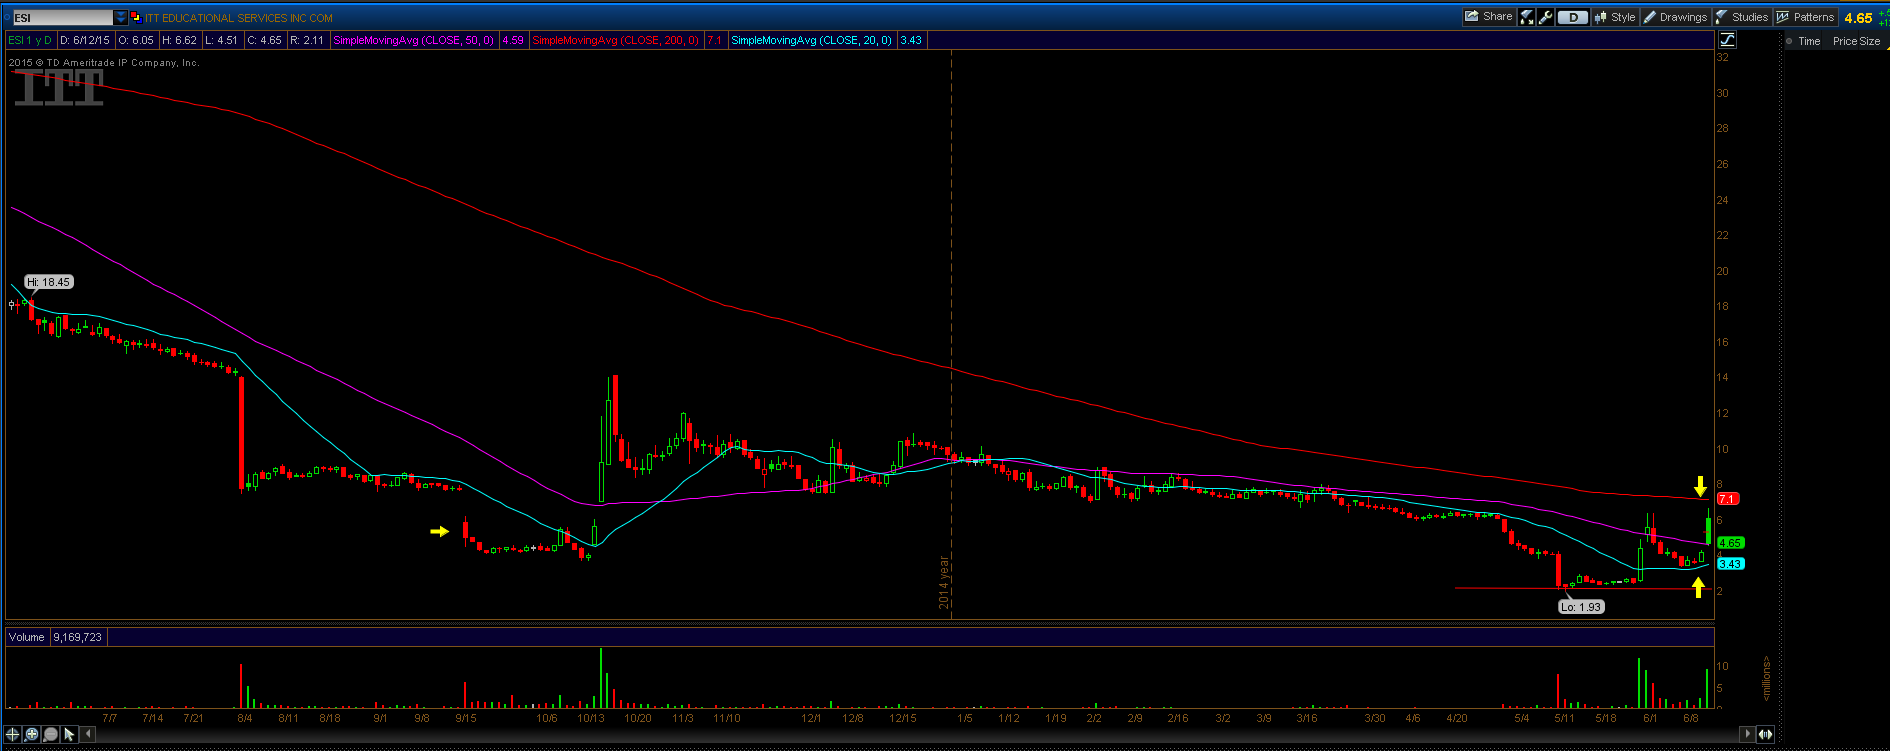
As you can see there are several key areas of support and resistance. Starting on the left, the yellow arrow displays an area of resistance that dates back over 6 months ago, this also happens to be an area of support in which $ESI broke through before forming what looks like a cup-n-handle. The other two yellow arrows, the one pointing up shows support and the one pointing down shows resistance, which also happens to be right at the 200 day ma. This MA is a key area of support or resistance, so I knew that the best gain possible was around a $2 gain from the closing price on 6/11 which I happened to be dead on. The stock reported earnings the next day and spiked to over $6/share. I also knew that this stock had almost 40% short float so a $2/spike into resistance was very likely.
Below is the intra-day chart of the 5-min from 6/11
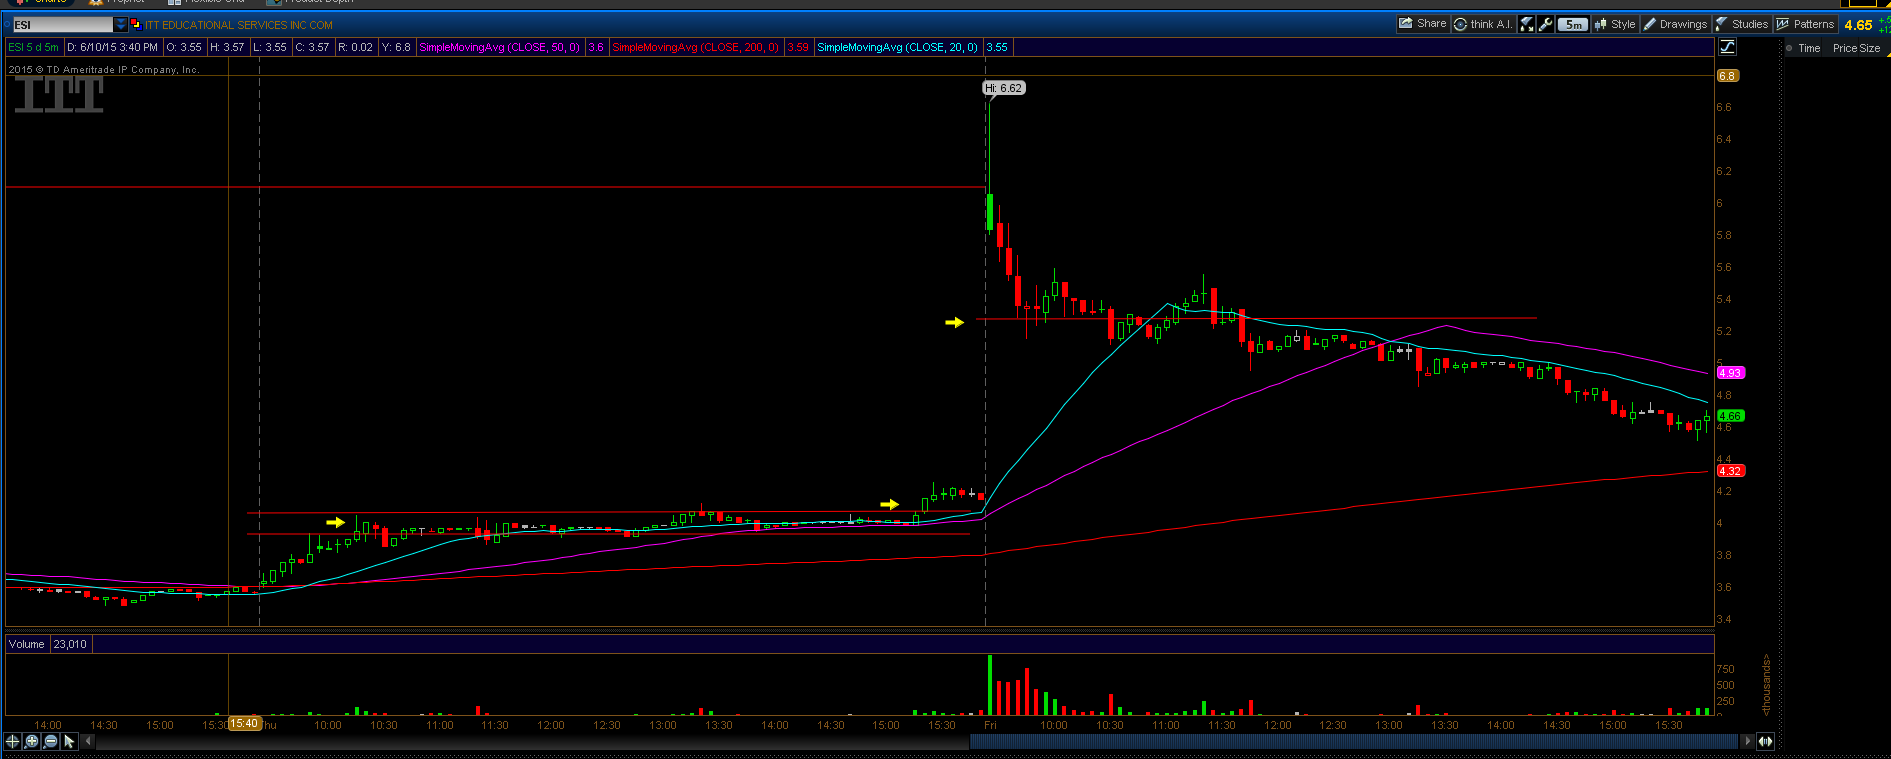
As you can see, the yellow arrow on the left shows the candle stick that happened to form the morning high. I knew that if this stock were to run it would have to break this morning high. I placed a stop order to buy just a few cents above it at $4.07 which happened to be around the end of the trading day when the stock broke out of its afternoon consolidation. With only a $130 account, I bought around 30-shares to hold over night with the anticipation of a morning spike. (This was in tandem to the cup-n-handle forming in the daily). When I woke up the next morning, I jumped on the chat room and $ESI was spiking due to good earnings. I knew at this moment that I had finally enough confidence in my trading to understand what patterns to look at, when to buy and when to sell. When market opened, I instantly placed a trailing-stop loss of only $0.10 so that I can lock in profits if the stock tanked, but also gain profits as the stock rose. Because I work during the day, I can't always be at my computer so its important that I lock in any profits that I can when I am not there to do so.
Because I placed my stop at $4.07 with only 30-shares, my risk:reward was great. I had a mental stop-loss of $0.10 when I first bought this stock because if the stock spiked and then fell back down, then I knew that this was a fake breakout and the stock would fail to run. The most successful day trading strategy that I have learned is to wait at least 15-30 mins for the stock to create its morning high using the 5-min chart. If the stock breaks its morning high along with other positive factors, chances of the stock running are good. This seem's to be the most successful trading strategy I have found, especially for people new to the market, or those with small accounts that can not handle large losses yet.
I started the week with just $130 and after two successful trades I have successfully brought my account up to almost $200 before my $500 cash deposit. I feel its important to learn as much as you can. Tim can only teach you so much, its up to you to take the time to learn on your own. Candle stick charting, volume and chart patterns are keys to success. Knowing when to buy and knowing when to sell will keep you in the game. Hopefully I will be able to make enough money to quit my day job and only trade as a retired trader. Until then, cut losses quickly and let your profits run.
lol good plays, and good call on NUGN, man I had the itch and I wanted to buy too but I noticed that coming once it started acting funny..just gave me bad vibes so I just gave it a day or so of watching both days it closed and it was arching like it was getting bent it was just a matter of time b4 it snapped.
Join now or log in to leave a comment