How do you find a stock with the potential to have a major trend reversal ?
I"ll get to some examples soon but first lets go through the most IMPORTANT things to look for when trying to find these types of stocks.
-
First off your going to look for the top 1 month, 2 month, and 3 month percent gainers on the NASDAQ ( i only look at percent gainers )
-
You want the stock to be up over 300% in the last 2-3 months, the more the stock is up the better your odds are to be successful shorting on the trend change.
-
The stock should be up-trending more rapidly as it continues to make higher highs, lower lows.
-
Volume is key, when the stock is about to b/o making a new high in the trend, volume should also be making a new high ( Its not an exact science )
Here are 2 examples, $DSKX , $TRCH and I'll go over one in-depth later in this post.


What are the key indicators of a coming trend change ?
-
Volume not corresponding with price action. If the stock makes a new high but volume doesn't follow with it. This is an indication that the strength of this stock is starting to dwindle. ( not an exact science, and only applies to breakouts/making new highs)
-
Fading volume, the stock is losing interest/buzz, can result in the stock not up-trending as rapidly, sideways price action. Just becomes a slow moving stock until it nears support or resistance where it'll pick back up. ( Again not an exact science )
-
Inability to make a higher high, IMPORTANT sign of a trend change to come. Shows the bulls are becoming weak, bears getting stronger.
-
Double top, stock is unable to break through resistance, signalling buyers are less aggressive (losing confidence in the stocks ability to run any longer). Lots of short sellers seeing this will gain confidence. Whats MOST important is you watch to see the reaction to the double top, does the stock consolidate to previous support levels and hold them ? if so the stock may retest the double top, or does it crash through support levels then attempt to bounce back to those levels ? If you see the stock bounce be ready to short ONLY if it FAILS as this's a great opportunity to enter your short position.
-
Forms a lower low on a big red day and tries to bounce the following day. Great time to enter size in your position. ( If it's the biggest red day the stock's had since the beginning of the uptrend, this usually means the end is near and it might not bounce the next day so be prepared to short )
-
Barely able to make a higher low/higher high, signals weakness in the up-trend. Watch carefully for what follows when you see this.
-
Sideways price action. Indicates uncertainty in the crowd, weakness or lack of interest in bulls, foreshadows a reversal. Pay close attention to sideways price action especially if the stocks already gone supernova and is up over 300% + in the last 2-3 months.
-
consecutive little red days. If you see the stock's made an abnormal amount of consecutive red days relative to when the pattern started, this is a sign of a trend change. The inability for a stock to close green/up on the day for 3-4-5 days in a row signals there's probably a much greater decline ahead.
-
Negative article on the stock. ( Expose ) Its likely there'll be some articles written on a stock that's up 300-600 % in the last 2-3 months. These articles can greatly affect the stock and begin a trend change
-
Potential toxic financing. Do some digging through the SEC filings see how in debt the company is, and if they're seeking to do a financing. Look through the quarterly reports as they sometimes state they're in need of X amount of dollars and want to do a financing.
How & when do you enter your position on this pattern ?
-
With a play similar to $TRCH or $DSKX you should NOT enter your full position right off the bat (unless there's a very good catalyst that will initiate a major reversal ). Sizing into your position is very important to reducing your RISK. Personally I like to size into my position 1/3 at a time. (**Ex. You see the trend has changed on $TRCH it's trading at 2.00 a share and it looks fit for a steady downtrend. Your looking to get into the stock with a maximum dollar amount of $1200, so to reduce your risk you enter the stock selling short 200 shares @ $2.00, now if the stock downtrends or up-trends the next day you look at support/resistance levels to add more to your position**) Again i strongly oppose taking your full position right away as doing so only increases risk.
To give you an example of when to enter, i'll be going over my trade on $TRCHbelow
In the image of the 2 month chart below, where you see the blue circle, this is when i first found and started watching $TRCH very carefully.
Now looking at this image pretend you'r in my position at the time of when i first saw this stock, and you cant see anything past the circle.
What I saw at that time was possibly, the beginning of a major TREND change. Before you read any further lets see if you've learned anything from this blog-post, looking at the 6 month and 2 month chart of $TRCH write down some reasons as to why i'd/you'd think a major trend change is to come ?
( Feel free to look back at the key indicators i talked about earlier if you need to )
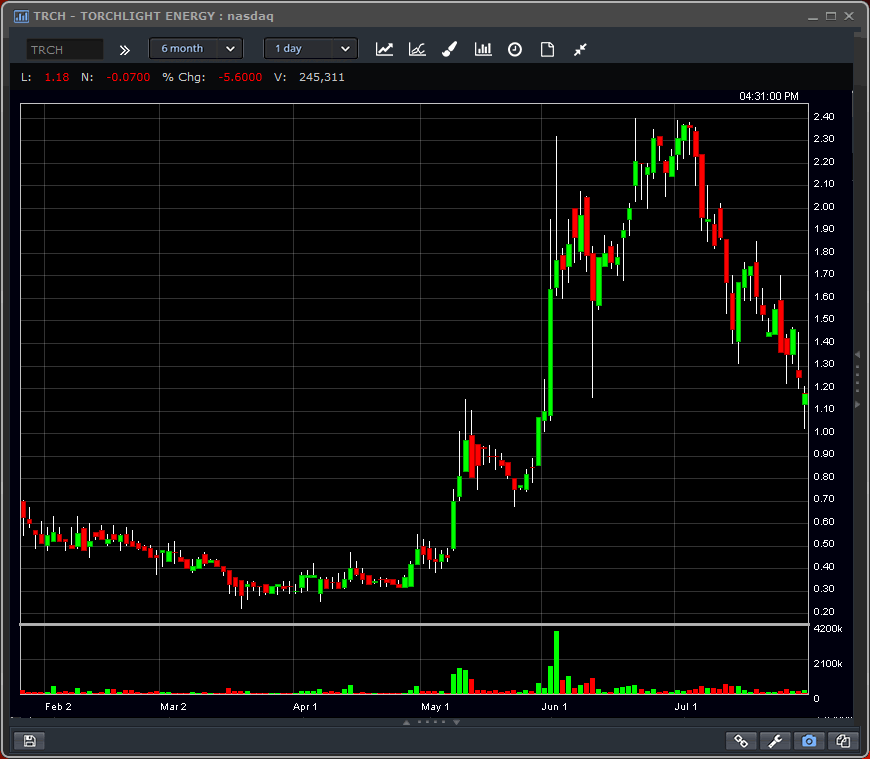

Hopefully you've written down your reasons...
1. look 2 and a half weeks prior on June 22, $TRCH makes a new all time high in the pattern... BUT the volume doesn't follow.
2. From June 22 - July 8th the stock forms a lower high then proceeds to barely make a higher high, then double tops. ( Very very bearish )
3. June 29th stock is unable to make a higher low and actually double bottoms.
4. Double top at the 2.38 high on July 1st and July 6th followed consolidation below support levels then attempting to bounce BACK to support levels. ( Most important indicator, and best entry )
( If you see an indicator i missed feel free to comment below and let me know what you see that i'm missing ! )
By now your probably wondering where it is I actually entered the stock. In the image below where you see the first arrow on the left hand side,

I shorted a whopping 50 shares ( 1/5th of my order ) @1.89 going into the close which id hold over the weekend. My thoughts on entering there were posted here ...
TRCHShort StockbyThe_Kid_TB
Entry comments: Short this stock over the weekend, only got filled 1/5 th of my order sadly but a nice close dropping 5 cents in the last minute. The bid was getting hit hard and this stock took a major reversal this week. I'm predicting this trend change continues through the next week. looking to build into a $1500 position over the next few trading days. shorting into any large spikes. Will short a bit on open MONDAY if it shows sideways price action. Cant define my risk until i have a greater position.
Posted: Jul 10, 4:48 PM
So i got a nice close below support going into the weekend, my thinking was short sellers would see this over the weekend and prepare to short hard Monday morning...
However Monday morning $TRCH gaped up on a positive but pathetic press release. "Torchlight Energy Confirms Scientific Results for First Orogrande Project Well "
I watched the stock carefully as it down-trended mostly all day from the open, then going into close where you see the second arrow on the right hand side i shorted 600 shares @ 1.88 ... My thinking upon entering that position was that there'd be a morning panic the next morning because even on good news the stock couldn't hold any of its gains coming right back down to yesterdays lows.
The 1 day chart image below is what happened the next day. Sure en
@Rdb Of course !
Great post man. Loved the part about taking profits, would have taken half my profit when i was up by $130. As tim sykes says realized $ is better than lost profits.
@akalur1892 Yep ! thanks for the feedback
Nicely laid ,easy to understand,i learnt from this experience thanks,i see also the Doji candle at $2.00 on the 1 day chart with a slight more bearish attitude,the next candle after that would have been the catalyst for me to place a short,thanks again .:-)
Join now or log in to leave a comment