Market Buy orders were spiking to new highs, but price action did not, so I drew that level where the sellers came in. The bottom had buy limit orders holding price @ $6.60 but failed to break above the wall of sellers because there were no market buy orders to push higher. Once the buy limit orders failed, that level became resistance. Easy for me to see this, but didn't have the nerves to short it. I would be trading blind without this info and this gives me an edge over others who are trading off price action alone, I just need to have more courage to take these high probability trades with confidence. Tim is so disciplined to cut his losses quickly when the stock doesn't do exactly what he expects and if that is the only thing I learn from him, it would be save me a ton of money.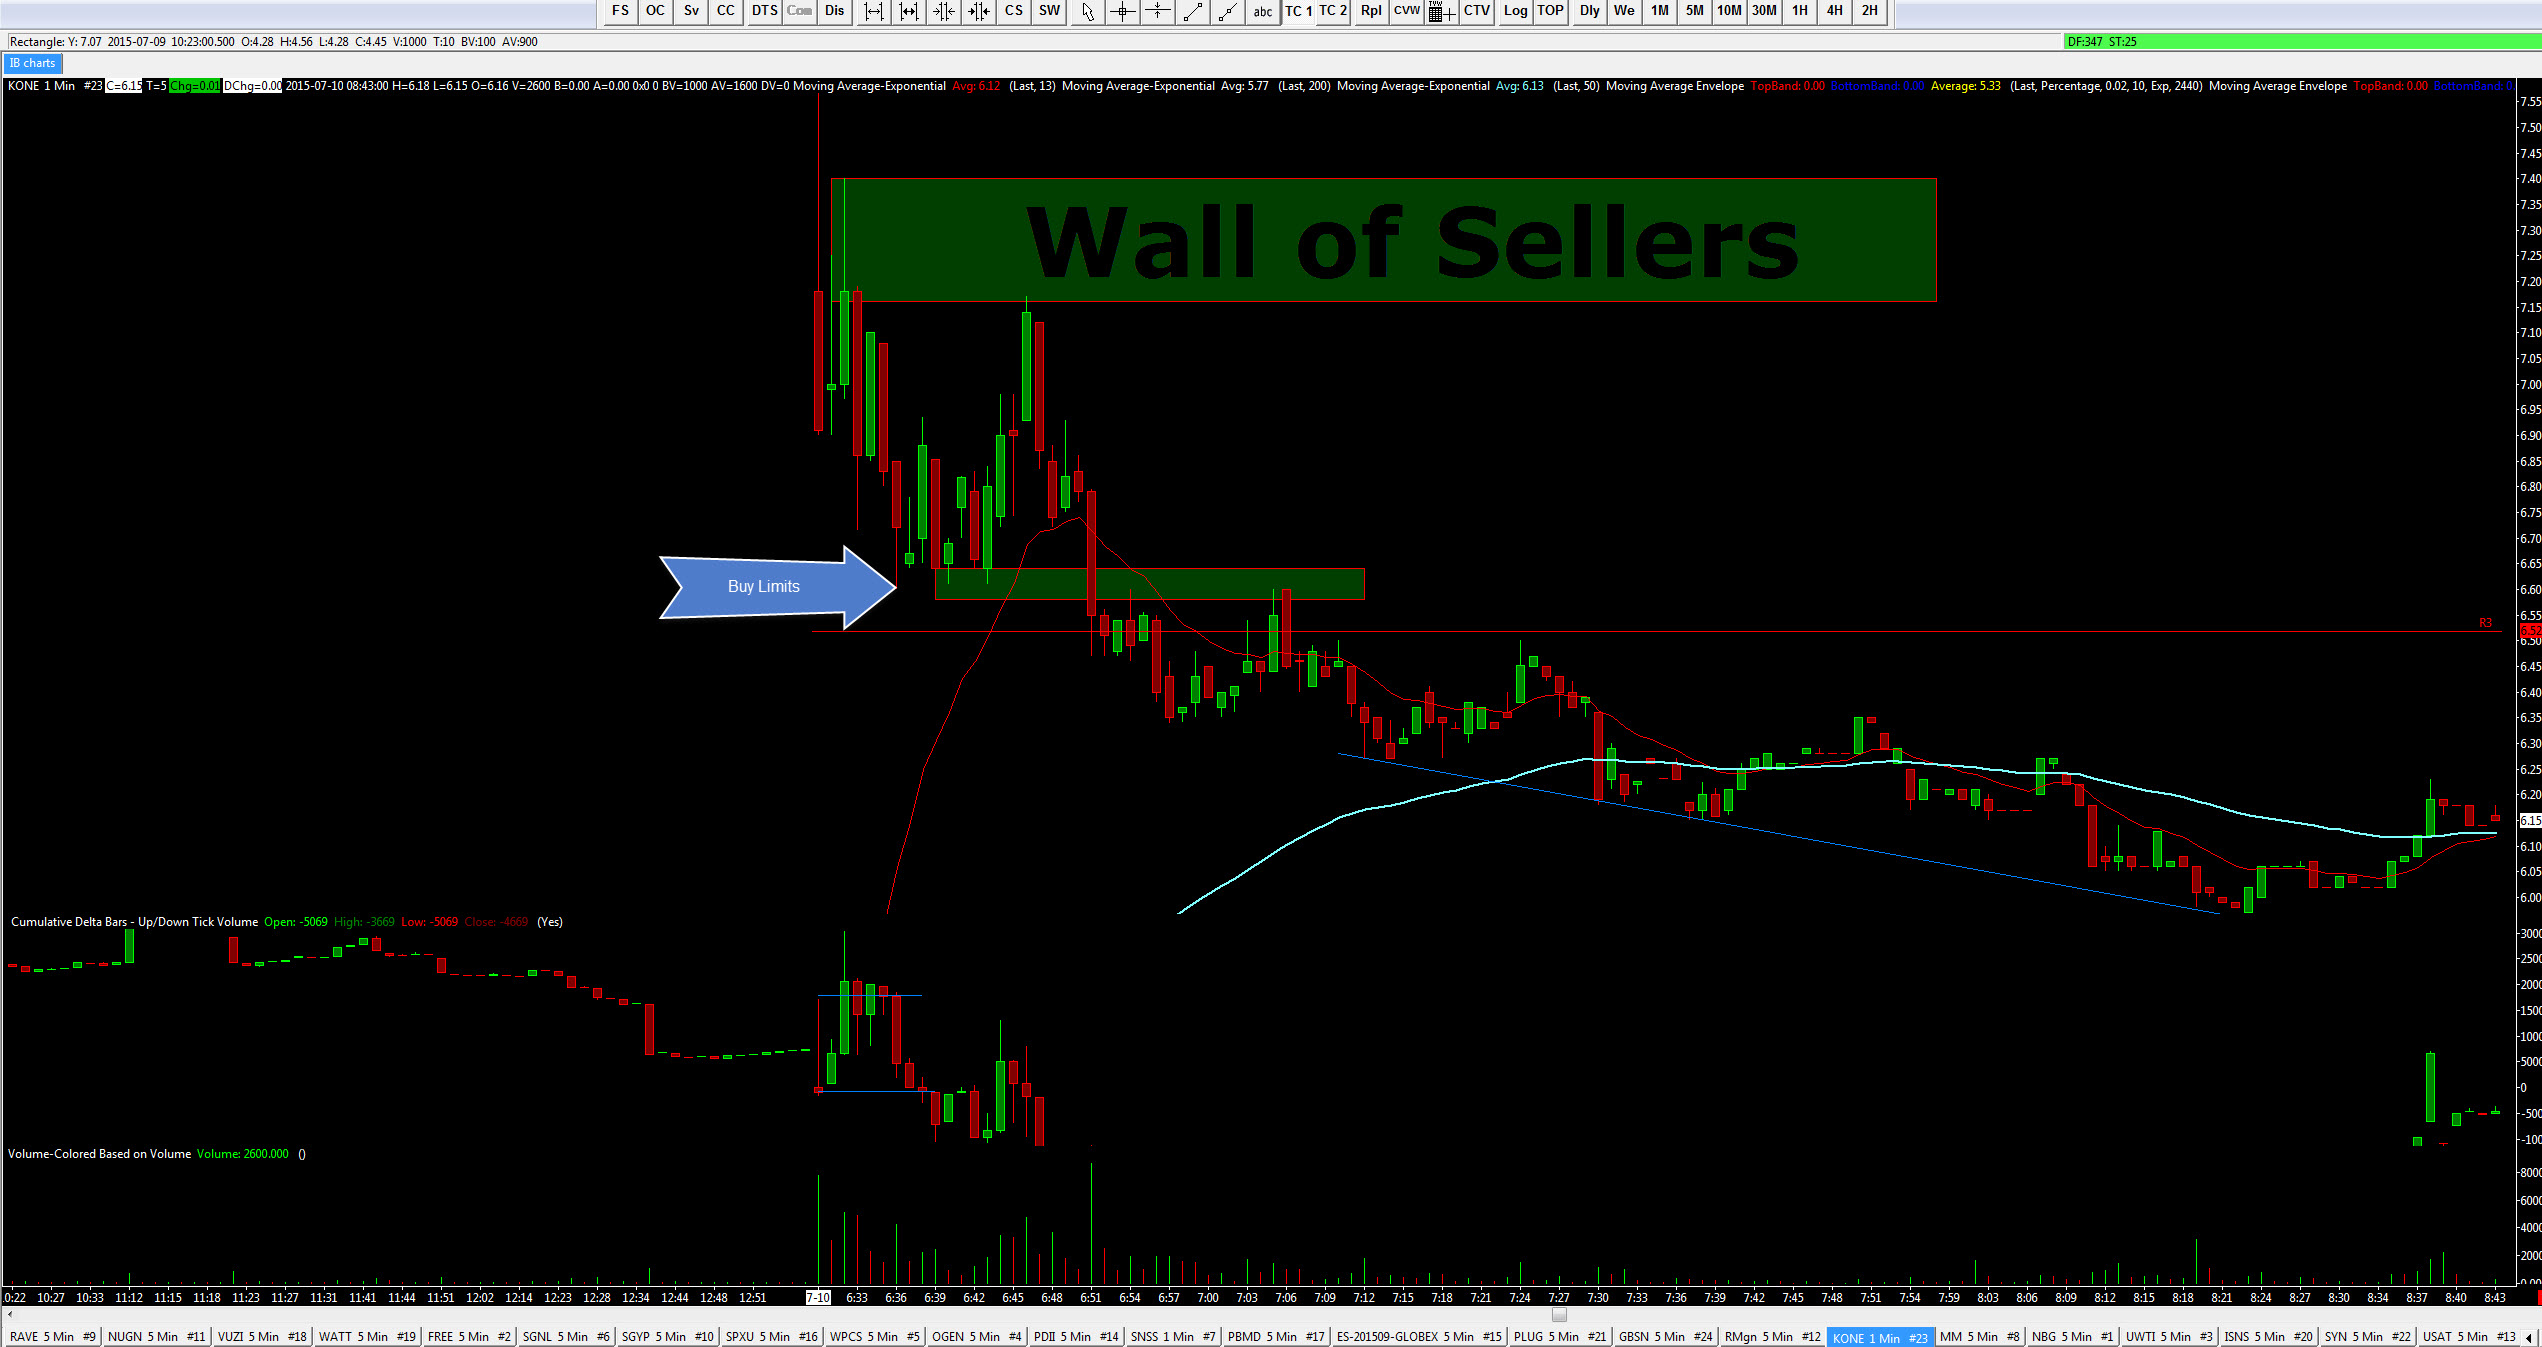
Received 1 Karma
yes it's a good place to short when buyers disappear at that point. try a small position then test the line of resistance until big buyers come in and break that line. be careful of fake trades that appear and disappear or appears on both sides. watch both 1 min and 5 min charts for trend line change along with the lvl 2 action.
what indicator are you using at the bottom to track those orders coming in/drying up?
Market Delta on Sierra charts using IB data
Join now or log in to leave a comment