I use StockFetcher from time to time along with the Think Or Swim scanning tool and they can both pretty much do the same thing. The StockFetcher code is a little more user friendly than the TOS code but if you're kind of a coding geek, or just plain old geek like myself then you really don't mind the technicality of it all ;)
So when scanning for breakouts I think it's important to have the volume to go along with it. These are the setting that I use:
---
Last: Between .50 and 10.00
---
Price Change: CLOSE is at least 1% greater than 1 bar ago. If you only look for the volume increase and not a positive price increase to go along with it then you will get stocks that had a price drop with the high volume also...That is a price breakout but to the downside.
---
Unusual Volume: Current bat's Volume Increased by at least 150% from 1 bar ago.
This is the volume spike...you can set this to anything you want.
---
Average Volume: The 10 period simple moving average is greater than 300000
Of course you want some good decent volume over the last few days.
---
Average Volume: The 1 period simple moving average is greater than 200000
And you want at least some kind of decent volume during the spike
---
Set these as you see fit. Then filter through the charts looking at the daily and plot the support and resistance levels, then on to the 1hr, then 1 min...that's sort of what I do. Sometime the chart looks terrible, sometimes it looks 'tradeable'...those are the ones to keep.
Here is a screenshot of the scan results after the close today:

You can also run this scan during the day to find those stocks that are actively moving.
Now the Goldilox Zone of volume...that I forgot about.
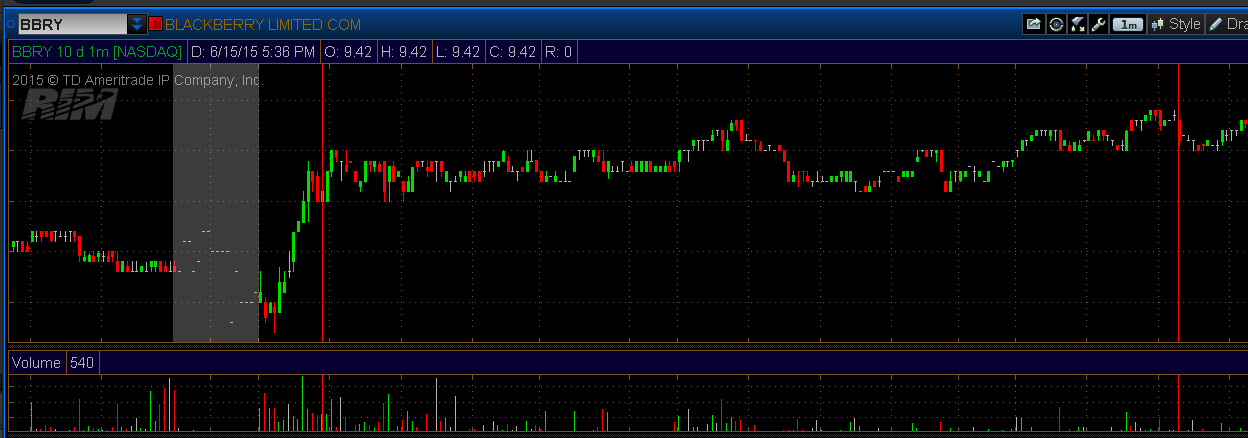
Today I had my 'Pick 6' of stocks but I was running another scan (still in the works) that was beginning to trend. I waited for the dip and the return in buying volume to get in. I looked at the daily, of course, before getting in to check the SR levels along with the volume...all good...Here comes the but...
There was too much volume, too much Level 2 volume. The ticker was BBRY and there was about 100K per current price on each side of the BID and the ASK and it was barely moving. A few orders were going through but not all of the action was getting taken. It took about 3 hours to pull out about 8 cents of the move and there was no real price drop after I got in. The high for the day was about 5 cents above that. I just wanted to get out with at least something and not be holding this in the afternoon and see it tank. There was resistance at 9.35 from the previous day but the buying volume during and after the dip entry got me thinking that 9.35 was going to be easily taken out and I would catch the breakout. Oh well....got out and played it safe.

To sum this up...I think there is a better chance for movement when there are a few thousand per BID ASK price level vs. a few hundred thousand....the Goldilox Zone of volume.
Please note that this 'Geek' also fishes the flats, surfs, awesome cook, single malt scotch with a good cigar, hits the gym, can run a 5K no problem, duck hunter, can remodel your bathroom, install flooring, some car repair, and hang you ceiling fans or build your deck with fire-pit while listening to The Clash or The Editors too loud....and really digs Star Wars...just throwing this out there....
ok, sorry about the mistake..you can actually change that around as needed. the tmost important variable is the volume spike. you can use 100, 200, 300% etc but make sure you compare that to the previous day. the lower % number you use the more spikes you will find. the volume ranges can vary also. if you use the 1 day and 100,000 in volume with a 100% increase
in volume then you at least know that the scan found a stock based on that one day spike that had a volume of at least 200,000 shares traded...not very significant. however, if the one day vol average was say 500,000 and you used a 300% spike you know that stock traded with more than 1,500,000 shares. then if you use a 10 or20 day moving avergage of the volume with say 300,000 then you can see from the scan that something is going on with that stock.
i would use the 20 period or even longer like 30 or 50,etc. This gives you a better idea of where the stock volume has been the last few months and if that 1 day volume spike is 2 or 300% greater than the avergage for a longer period that might be mroe relavent, 'the sleeper has awaken!" sort of thing.
there are no exact parameters to use with the values. but remmeber the 'easier' yo umake it to find volume spikes, like a 50% increase in volume the more results you will get = the more charts/news to go through. you can even limit the price parameters to .50 to $5 if you are looking to zero in on a price range. hope some of this helps...let me know...
Join now or log in to leave a comment