Hasn't been much talk about POZN in the chat room but I've been noting this type of thinking because in a sense...It's very
logical
 ...to think this way.
You can scan, scan, scan, and jump from chart to chart to chart from the chat room chatter and it can drive you crazy sometimes. You get lost in it all and end up with one of our trading friends aptly named Analysis Paralysis coming to visit you for a while.
We all know that we are supposed to be doing our own homework here and study to pass the test almost every day. What test? The trading test. You pass and you make money. You fail and you lose money. Just don't fail too badly or too often and you'll be around for a while.
We get our alert list from Timbo and what or how we should be looking at things. More often than (or then?) not it can be a waiting game for one of these alert tickers to set up for us to take action. Sometimes our brokers don't have shares to short and all that patience we put forth to wait for an entry is REJECTED...like you were when you asked that hottie out...soooo many times.
So why not seek those tickers that are already trending hard...I mean a solid uptrend or downtrend (if you can short that symbol) and specifically look for entries within that trend during the day.
Again, find a trending stock or two or three....and ONLY monitor those symbols for the same trend direction entry intraday. For the past several days I have been monitoring ANTH and POZN because they have been trending up very well so I started thinking...Why not just look for ONLY long entries within the day and jump on the train?
- Long term trend already in place (even though it might only be a several day or few week trend)
- Entry bias is to the long side or short side ONLY per the long term trend
Sounds simple and if you think about it...it is...
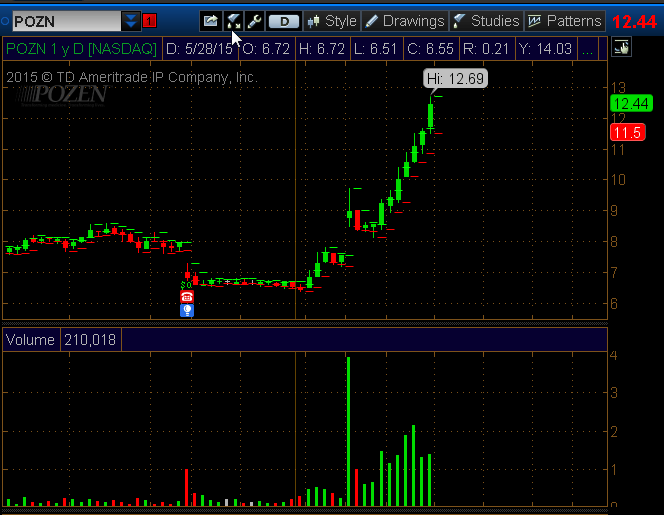
POZN..daily chart for the past few weeks:

If you don't see 'it' then please go back to making sandcastles for a living....
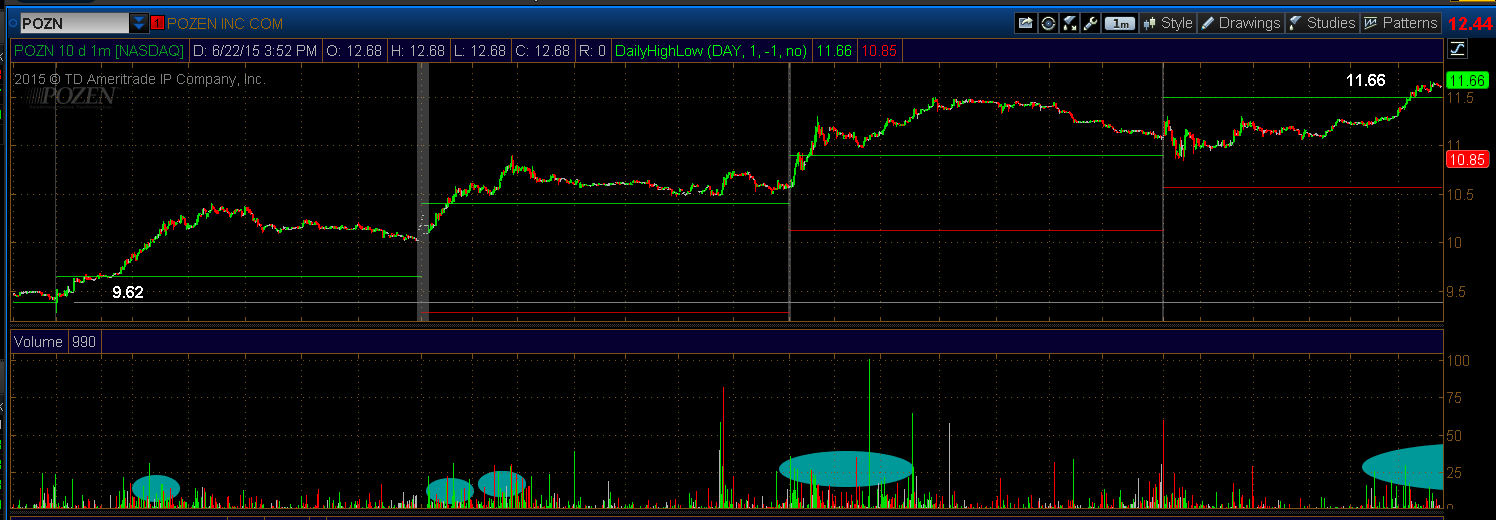
Those green and red lines on the candles are just the previous day's high/low that are plotted on the next day's chart. So on 6/16 when price broke and close above the 9.75 area take a look at the 1 minute chart. I've mentioned volume several times in the past and I have highlighted the volume surge areas. Take a look where price goes......with the daily trend in mind...
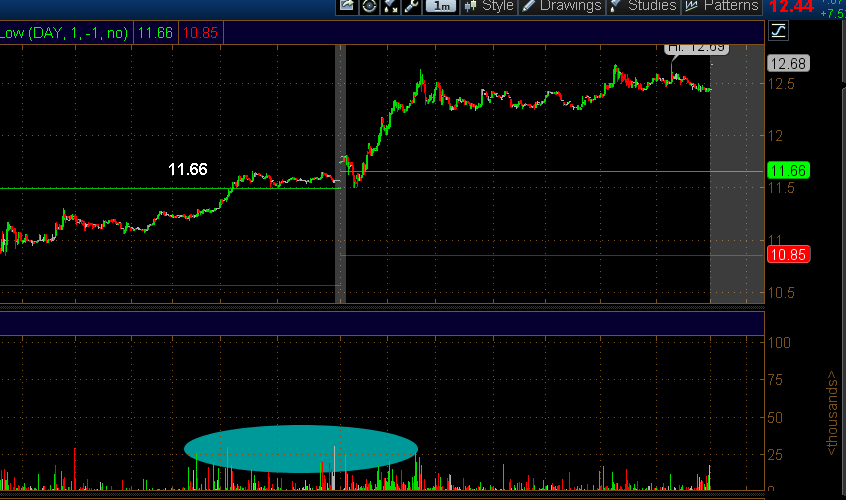
1 min charts from the past few days...from about 9.75 to 12.80


- Think about the trend continuing on the daily chart
- Think about the candle forming on the daily chart but watching it happen on the 1 min chart.
- Watch for the volume to show up on the 1 min and look for those intraday resistance areas or previous day highs to be broken on strong volume and get in.
Yes, you can simply buy and hold but we know that penny stocks are volatile and price can change 180 degrees very quickly so it's up to you to trade your way. I have yet to hold many tickers overnight but this may give me more confidence to do this. I would take a smaller position in the event something crashes overnight.
I picked off a few from POZN today and even on ANTH but if you notice on ANTH the volume is decreasing even thought the trend is still up so that tells me that price is going to pause or pull back AT ANY TIME.
So thinking of a rating system there ya go...how strong does the trend look NOW?..I'd put POZN as my main stock to trade only long and ANTH as my second choice with a possible short in the works.
Find and develop your plan. If you have no plan, do not trade. Blindly following will kill your account.
Cheers!
...the NUGN pump and dumps will be back along with the VLTC's..in the meantime going to be monitoring those tickers that have those strong trends. Will try to formulate a rating system too and post here. You can bet it will have a lot to do with volume ... ;)
solid stuff, I want to say I
...I'm in awe, so i will.
thank you
Join now or log in to leave a comment