Breaking down the $CANF price action from Friday 9/20/2015…
But before I get into this….just have to put it out there that I am still with TOS and I have to be biased towards the long side of things because of their more often than not lack of stocks to short. They do have stocks to sell that are under $5 every once in a while but my focus now is mainly only buy entries because my morning scans are focused on those stock that are moving and have momentum.
I am no expert. I’m just putting out there the way I see things. I most likely will take profits too quick but am getting closer to taking half of a position off at one of those ‘too quick profit targets’ then letting the remaining try to ride a little longer. Lots of focus and clicks in a short amount of time right there. When I have the time to trade at the house my 5 year old or so HP with AMD processor can get sluggish even with 12GB RAM so that is in dire need of an upgrade. My Toshiba i5 does a lot better away from the house.
Ok, Kev2714…here we go…
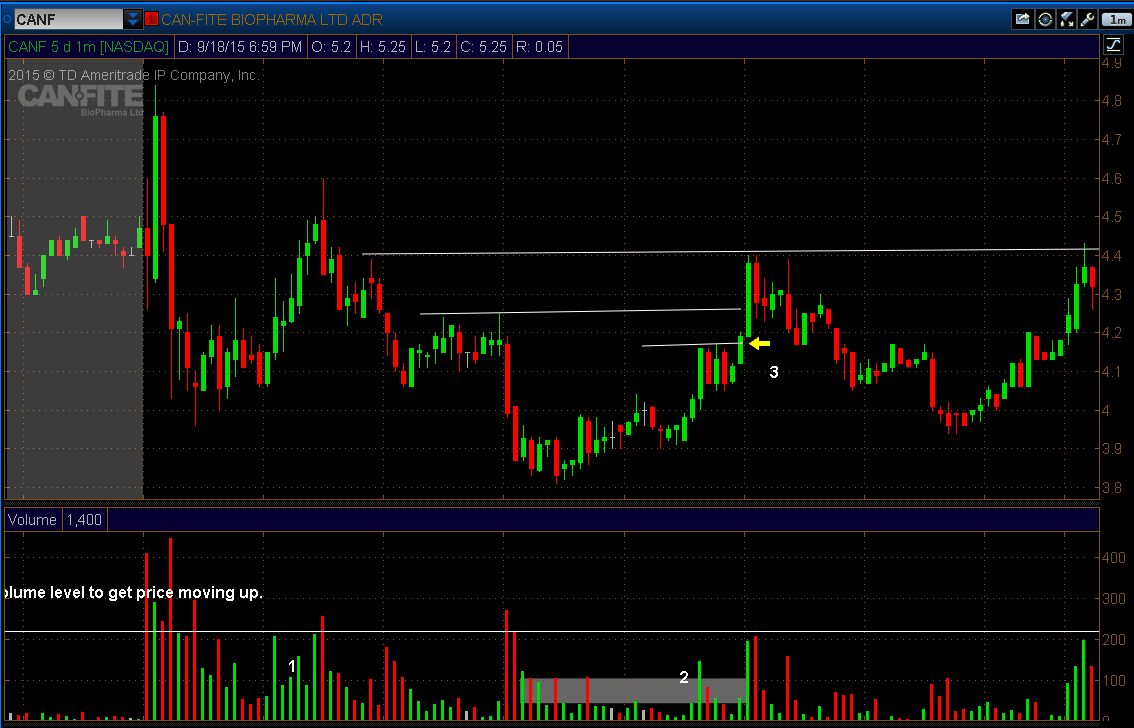
$CANF was riding a lot of momentum going into Friday but even so, the way I trade is to not buy or sell pre-market or gamble on the opening bar. I have to see a working trend and wait for dips or spot an area where price has consolidated I think price will get going. A few months back I started to draw a horizontal line across the top of the largest buying volume bar (a green up bar) or a ‘visible’ average of buying volume bars where the price started moving up. In the morning in $CANF there was a large green bar but the red selling bars were larger and the first several minutes were more numerous which tells price is down from here.
#1. Buying volume starts to show up so the question to myself is the morning high going to be taken out? The following red selling bar a few minutes after the #1 point tells me no. Remember, I am biased to the long side and there are no shares to short in $CANF in TOS. Some more large red selling bars show up with no green volume bars approaching the white horizontal volume line level = trend still down.
#2. Price is getting ‘interesting’ here. This is the largest up volume bar in a while and the overall volume leveled off quite a bit with the price not continuing down. The grey box tells me that there was more overall buying here than selling also.
#3. A resistance area forms. This is where I would start to focus on Level 2 to see where/if the Bids are getting hit and the Asks are getting taken out. The close breaks the resistance point and the volume bar hits the top of the horizontal volume line = the largest buying volume in some time. I would NOT call this an uptrend dip buy yet. This would be a price might get a pop here and try to get a few cents area only. Price action will do whatever the hell it wants to. So this was a 20 cent pop that abruptly ended with a large red selling bar that was comparable to the previous height of the red volume sell bars and then became a resistance point. To me that means get the hell out now and/or if the Bids get taken out to the downside = get out now also. Twenty cents is twenty cents.
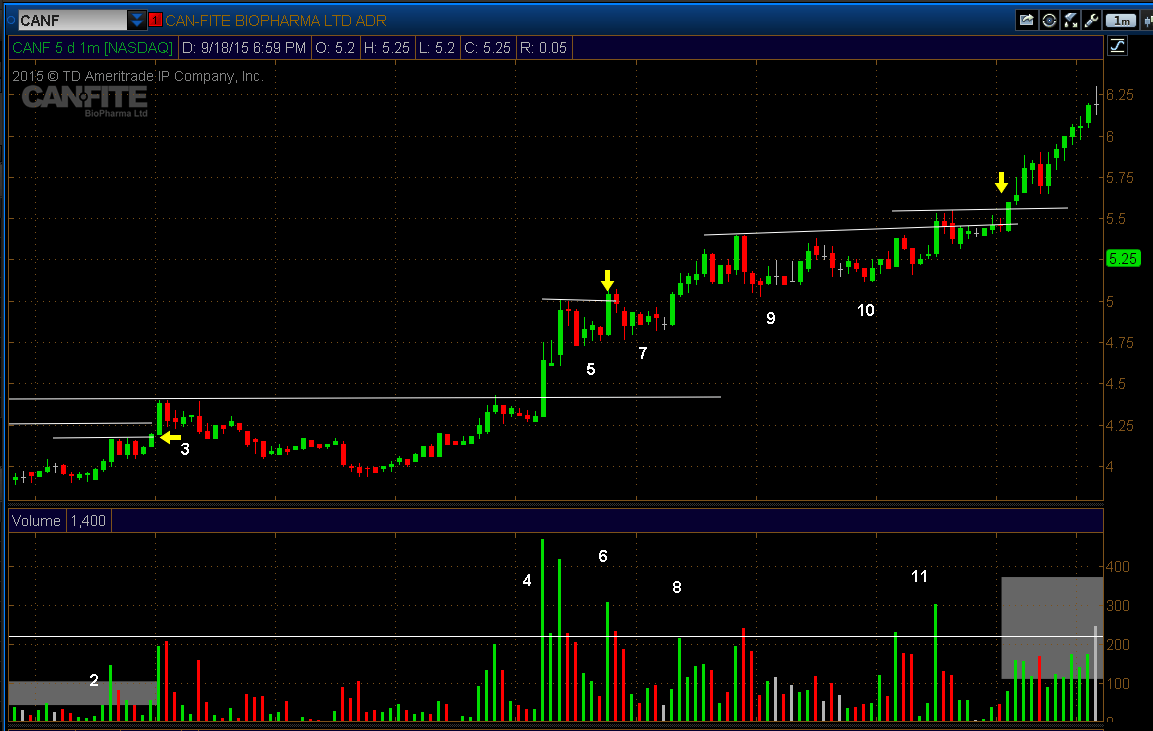
#4. Price really hasn’t fallen off and the overall price action has been channeling to barely up. Gotta keep in mind the previous day and the news pushing this along with some of the previous biotech runners that have had sick moves to the upside. The largest buying volume bar of the day shows up and the previous resistance point is broken which tells me that we might be establishing and uptrend again. Not buying yet. I have to WAIT FOR A DIP OR PULLBACK area to get in.
#5. The pullback. I look for any kind of resistance point even if it’s only two bars.
#6. I would have been monitoring Level 2 during this dip area and I am sure that you could have seen the Bids getting hit here to the upside. I would have bought during this bar and monitored the #5 area as support. That looks close but remember the per bar range was crazy and that support area is about 25 cents away which in my book is a lot of cash.
#7. Another dip and the volume is light…no selling and no real buying but monitor Level 2 here.
#8. Didn’t draw the resistance area which would have been a simple continuation of the line at the yellow arrow but with still monitoring Level 2 with the volume this would have been another entry buy area for me.
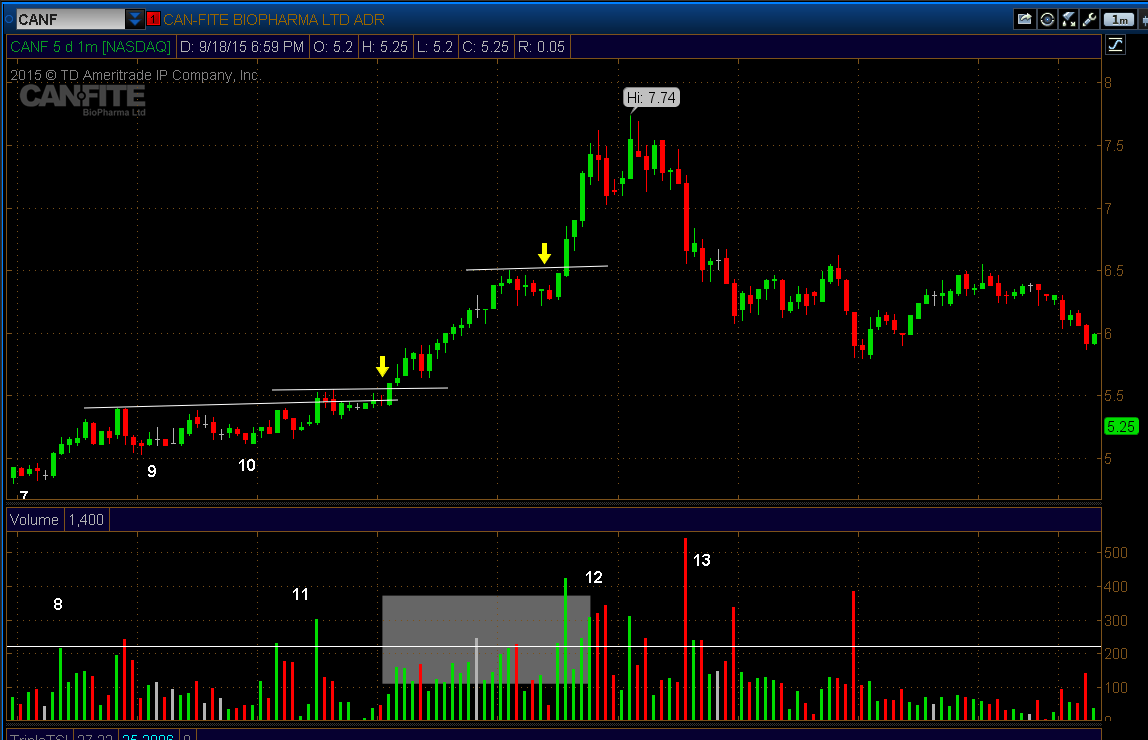
#9. Another dip with those two larger price bars being the next resistance area to get through, still monitoring Level 2.
What I look for in L2 is for the Bids just to light up and stack with the Asks just getting taken out. Large buys in Time and Sales…that’s it. Go with your gut and get in with the flow of the volume coming in.
#10. Price kind of channeling and but not selling off. Always monitoring L2 and Time and Sales (TS) for strength. No real dip but at #11 the volume shows up at the line again and the resistance is broken but quickly forms another resistance point with the following 2 bars.
Again, no real selling or buying at the yellow arrow I am sure that Level 2 and TS was screaming up and get in at this area…buy buy buy.
#12. (Right before #12) Price dips or in this case pauses, before #12 and I would have use the high before that arrow to look for another break to the upside for another entry. Again that large green volume bar would have been the one to get in on. Again, I am thinking that L2 and TS were telling you this bar was going to form before the close of the bar.
Yes, again this is all after the fact but these are the patterns I study. Draw the horizontal trendline on your volume bars and you will see this. It is NOT PERFECT. No trading method is but it at least gives you a starting point to go from. Uptrends or Downtrends, just look for the large red selling volume bars and go from there.
#12 again you see the largest 2 red volume selling bars back to back. The largest selling bars in a long time. If I was long I would definitely be looking to get out here or tighten up the stop. These bars are telling me nothing else that price is getting weak and might turn. Go back and look at any chart for the largest volume selling bar in the opposite direction of a TREND and you will see this ( a major pause or trend change) most of the time. It’s your money, trade it as you wish.
#13. In my book this confirms the change in trend direction. If I was an aggressive seller I would sell into the next rally.
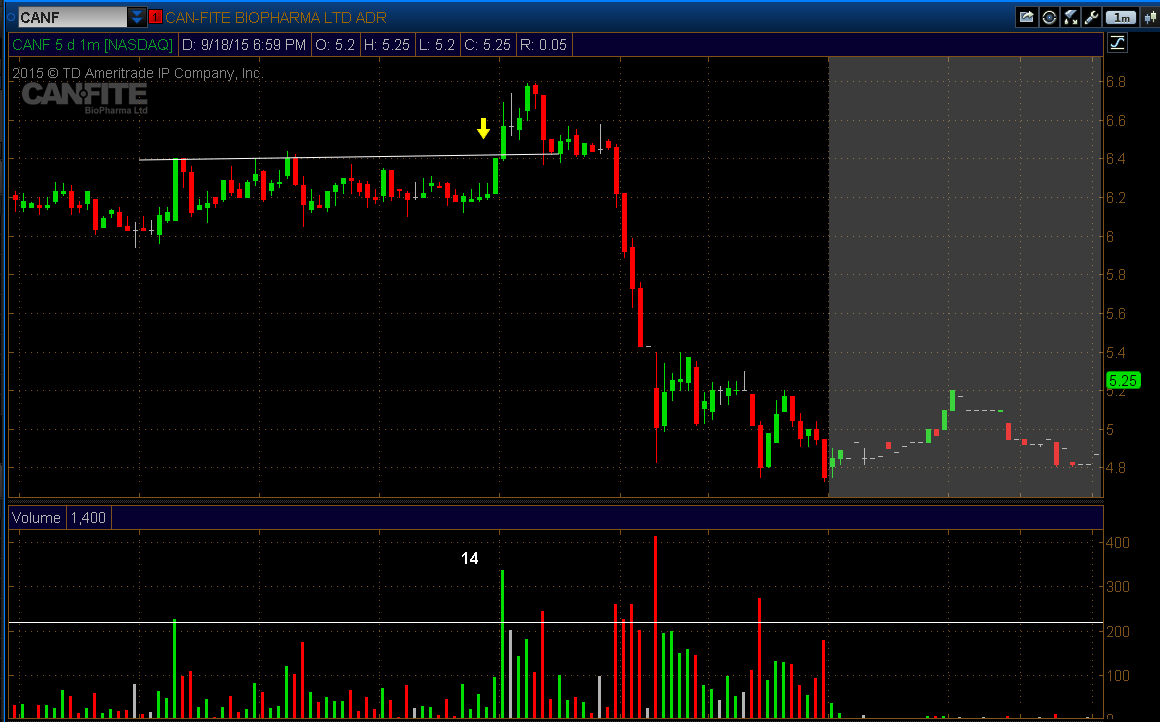
Price channels for the next few hours. There is a volume spike but price stalled. However, price holds around the $6.00 level for support.
#14. This is where I actually bought with the break of that resistance level along with monitoring L2 and TS. I, like everything else was thinking squeeze here. Volume breaks the the horizontal line I drew and price moves up somewhat and quickly forms another resistance point. Because of the way this thing was jumping around and with it not breaking through I’m watching L2 and TS for weakness now. IT shows up and I get out. Think I made $50 or so but I saw the weakness coming in. …it tanks and is halted from there.
This sounds like a LOT to look for during the day and if you are new to trading it is a LOT to look at during the day. However, as time goes by and you learn and RECOGNIZE what to look for it becomes more of a known process versus a ‘this is too much I simply can’t do it’. This stuff takes time and can’t be learned in a week.
I’ve been in and out of the markets for about 15 years but only seriously got into penny stocks back in December 2014 and never paid attention to L2 and TS. So, it’s only been that long since I have tried to pick up on how they work along with volume and price action and I still have a ways to go. It’s all a matter of how much time you want to put into something and how serious you are about using the markets to make bank.
A this point I can’t monitor the markets from open to close but can look for those stocks that might be trending in the morning and try to enter on the first few dips. That handcuffs me somewhat but I gotta take what I can get.
$CANF had very wide ranges per bar and was one of those ass-puckering plays per bar with the spread jumping around that if you were wanting to get in you simply do it and ‘suck it up’ in terms of that spread and let price just move with the trend. These plays are simply crazy but you can bank a bundle on them.
I made that one entry at #14 thinking we would squeeze but saw the weakness in Level 2 at the first red volume sell bar and got out. I traded $PAAS earlier in the day and made just under $200 so I was good with that and did not want to give that back.
Hindsight is always 20/20 and you would really have to monitor this price action ALL DAY. That can be a chore, boring, ass-crampy, thing but if you want this to be your job someday then ya better start to love it…yo.
I'll try to make a video of an actual trade soon showing the L2 action with the price action as it is happening. It's diffiult to 'see' this on an after the fact chart. My daily schedule just has to allow me to do that.
Time for some ball. Hope my Steelers can find it today.
Peace


hell of a break down man, really appreciate you and your time you took to put this together. its a good bit of info to take in but in time am sure it will be a lot more simple! if you could put a video together would be great if u could get time! Keep up the good work.
Thanks Kev...I did a quick video and will try to do one from a live trade on Wednesday if something sets up...
Join now or log in to leave a comment