First let me say, this is a hobby, a hobby I love. I love looking at charts. I almost love looking at charts as much as fishing in the Bahamas. My goal is to fish when I want, where I want, in the Bahamas. I look at charts to see what kind of edge I can find so that eventually, I will become better and hopefully over time, profit from the time I put in.
After reading this post, please post a reply on your thoughts which way this will go over the next three weeks (APPL UP, APPL DOWN, I DONT KNOW) if you care to reply. Thanks. :)
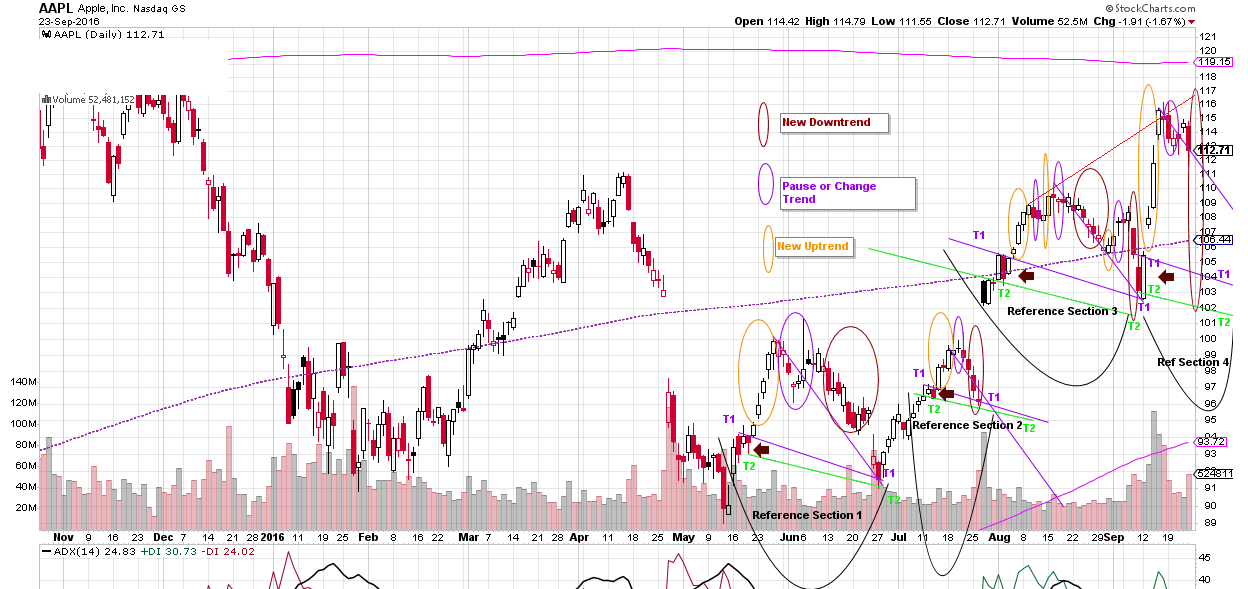
I've spent quote a bit of time looking for patterns in AAPL this morning. Enclosed is the DAILY chart.
If you notice, a ton of things repeat themselves.
Review Reference Section 1, then 2, 3, 4.
Notice that Reference Section 1 and Reference Section 3 have the same pattern. Reference Section 2 downturn is almost cut short. The reason I think is that T1 completed itself by touching the purple T1 line.
ONE EXTRA IMPORTANT THING TO NOTE:
T1 and T2 purple and green trendlines are all copies of Reference Section 1. (The slope of these lines (T1,T2) are identical when drawn from Reference Section 1 added to Reference Section 2, 3, 4. !!!!!
Crazy stuff going on here.
Thanks for the comments Littlemoney16
I look at apple everyday looking for patterns also since im moving into options. *Note* Im an intrday trader. The stock has a resistance up ahead, it just broke the channel (Support ) and its coming from Apples biggest % week/day move. If it does not hold the levels /channel next week , it will probably head down most likely. In my humble opinion.
Stocks usually reverse after big moves intrday speaking ,I guess it also applies to swing trading , plus breaking a channel is a good indicator.
Thank you Gibran
Join now or log in to leave a comment