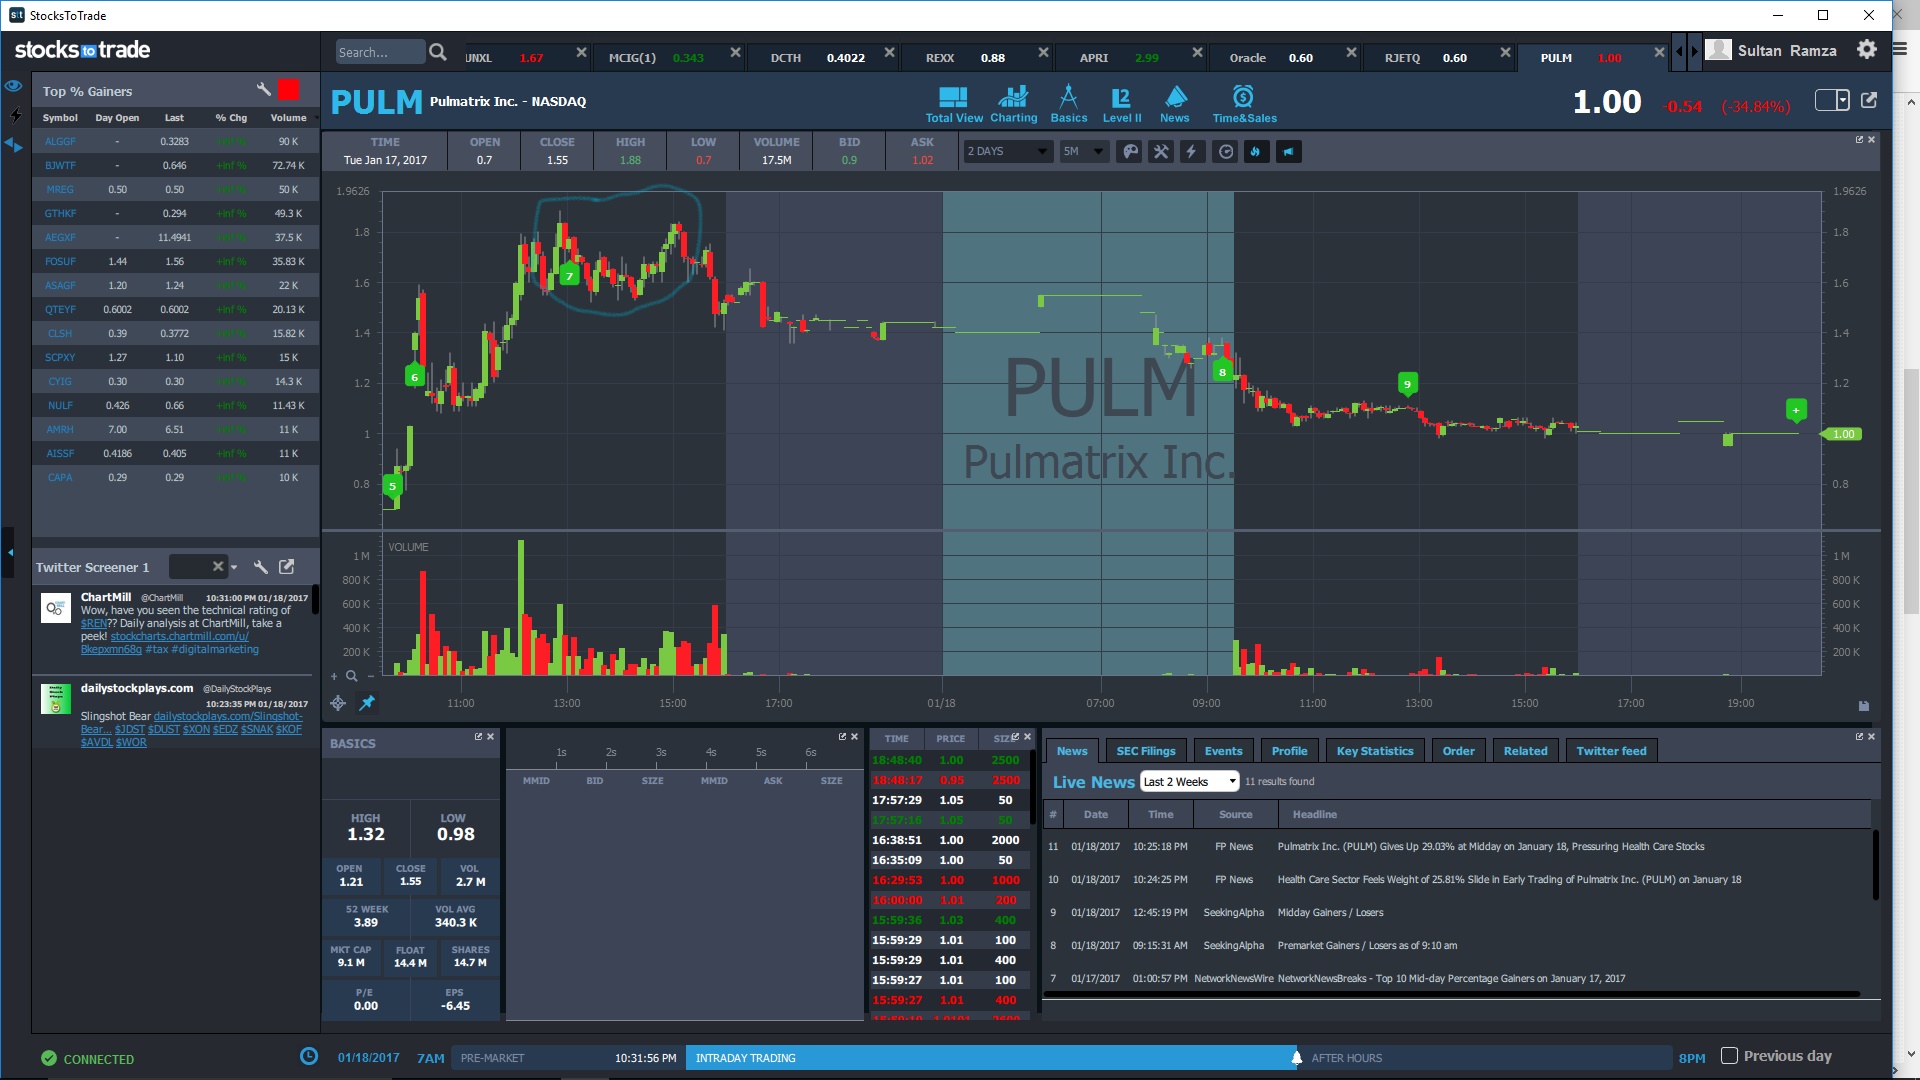
Howdy everyone. I've only been trading for 1 1/2 months, but wanted to share something I learned. Today I got hit over the head on an overnight position on $PULM. I didn't understand what I missed then I heard Tim mention the double top. On the image below I circled the double top, and now can clearly understand the inevitable decline. Now there's a possibility that it could of recovered, but that would be trying to predict the result, and I have been taught not to speculate, but rather to respond. Well my response here should have been to not hold an overnight position, but prepare to possibly short it in the market open.
Here's one more stock I was watching and again the same pattern shows up twice with the same result. After each double top a decline. Also notice that after the first double top the stock never returned to it's high. 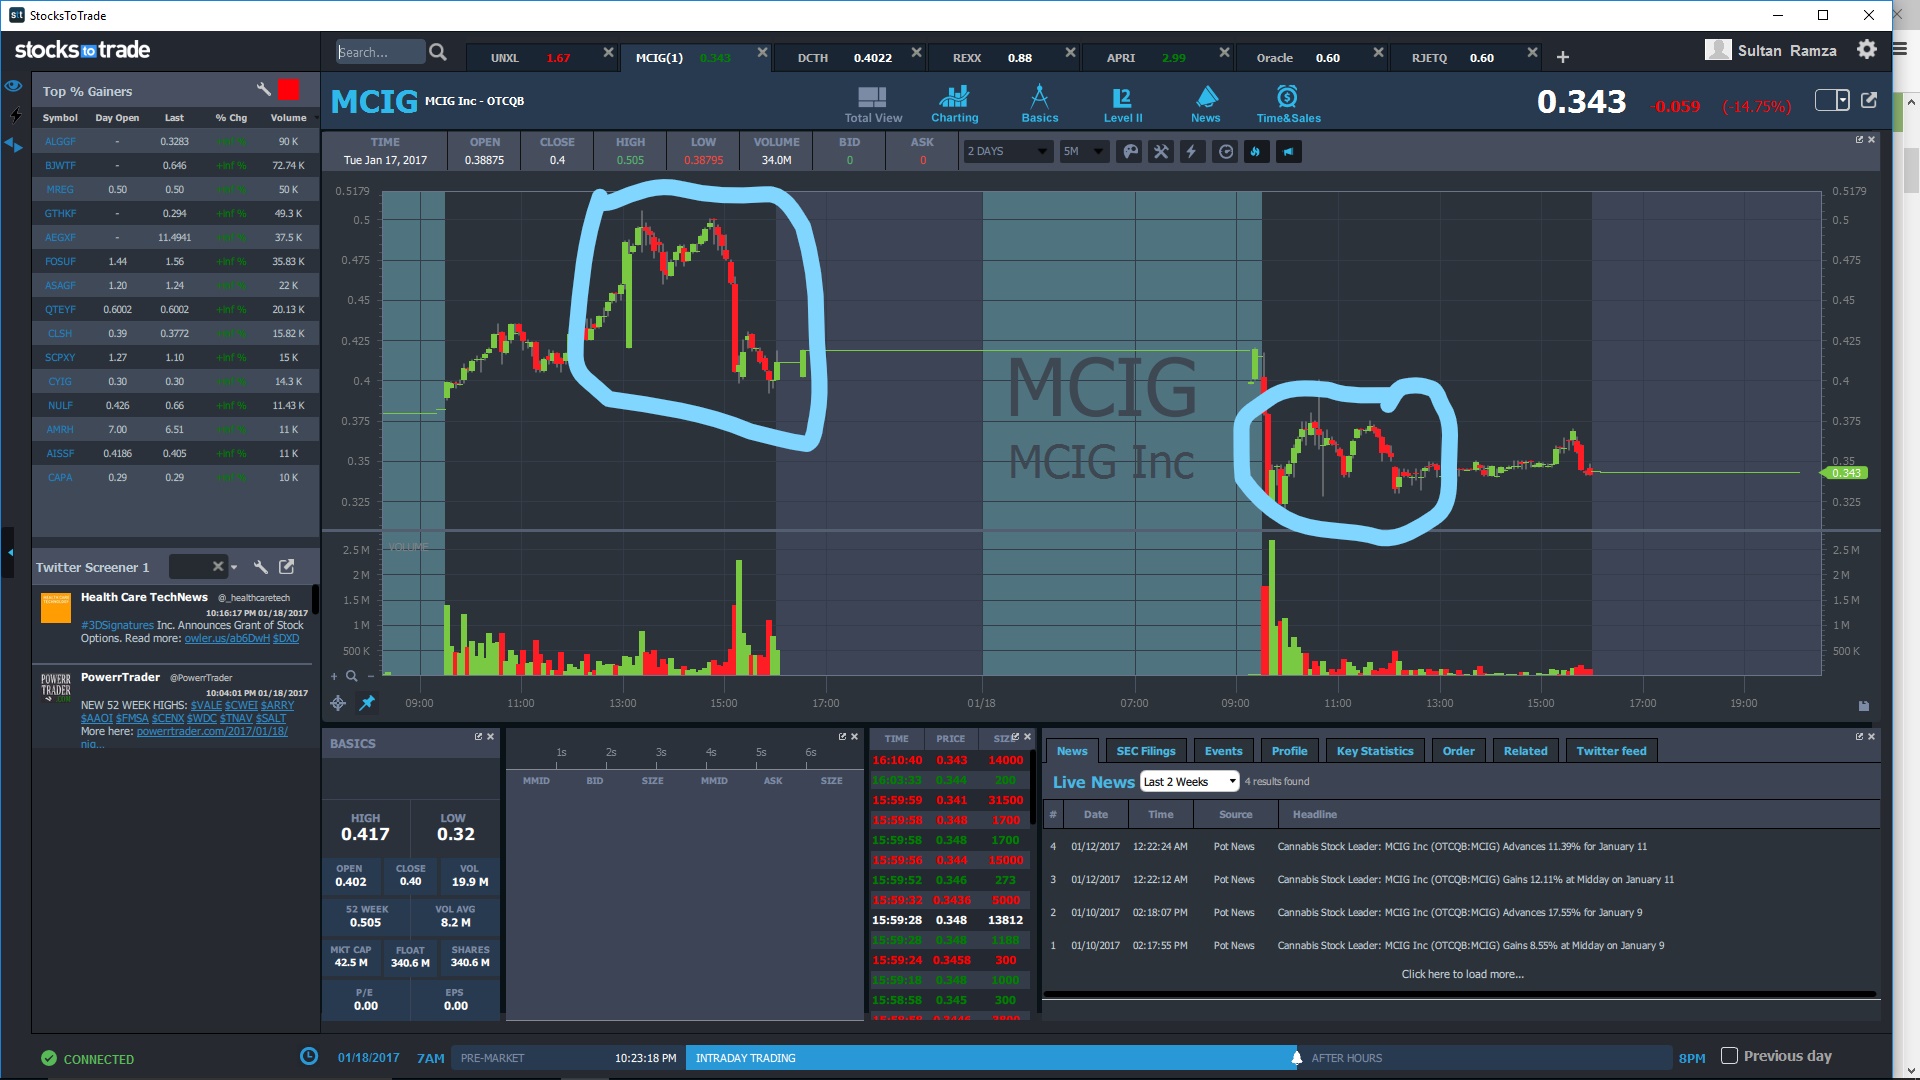 Hope this is helpful for other newbies like myself.
If you look at PULM's longterm chart, you see that it doesn't tend to hold its big gains AT ALL the next day. So it was on my watchlist but ended up crashing Day 2 like it had done many times in the past.
Tim often mentions the importance of looking at the longterm chart to see whether a stock that is really up has a history of maintaining its gains or not the next day
Will definately keep this in mind. Thanks.
The double top and also the double bottom is also a pattern a newbie like me has recognised recently, good work
Join now or log in to leave a comment