$SUNE
After Failing at $GBSN, I decided to watch $SUNE the rest of the day in order to get some confidence back. So I plotted my support and trendlines:
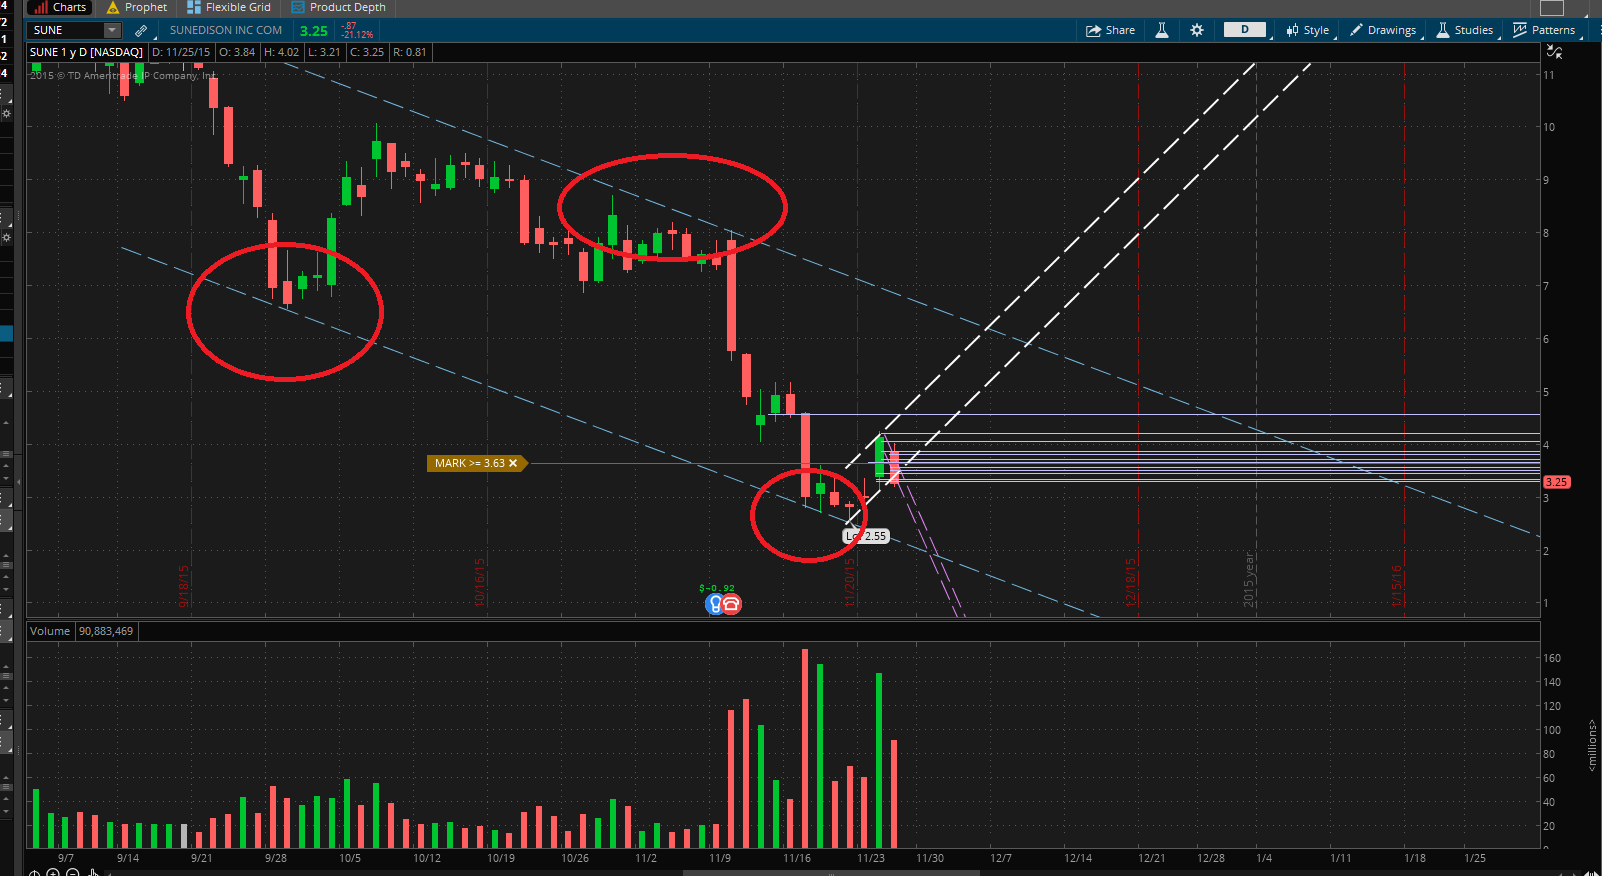
So I plotted a trendline over the Yearly/Day chart that I use. This is the overall Trend of the stock. A trade can always be fairly confident a stock will remain in this line. I lined up the channel on the Highs and lows that are seen circled in the chart picture.
Next up, I zoomed in to my 30Day/Hourly chart. I plotted in what I thought was the obvious trendline for this. So now I have a trendline showing the overall stock's downtrend, and a trendline showing the recent upwards trend being seen within the past week.
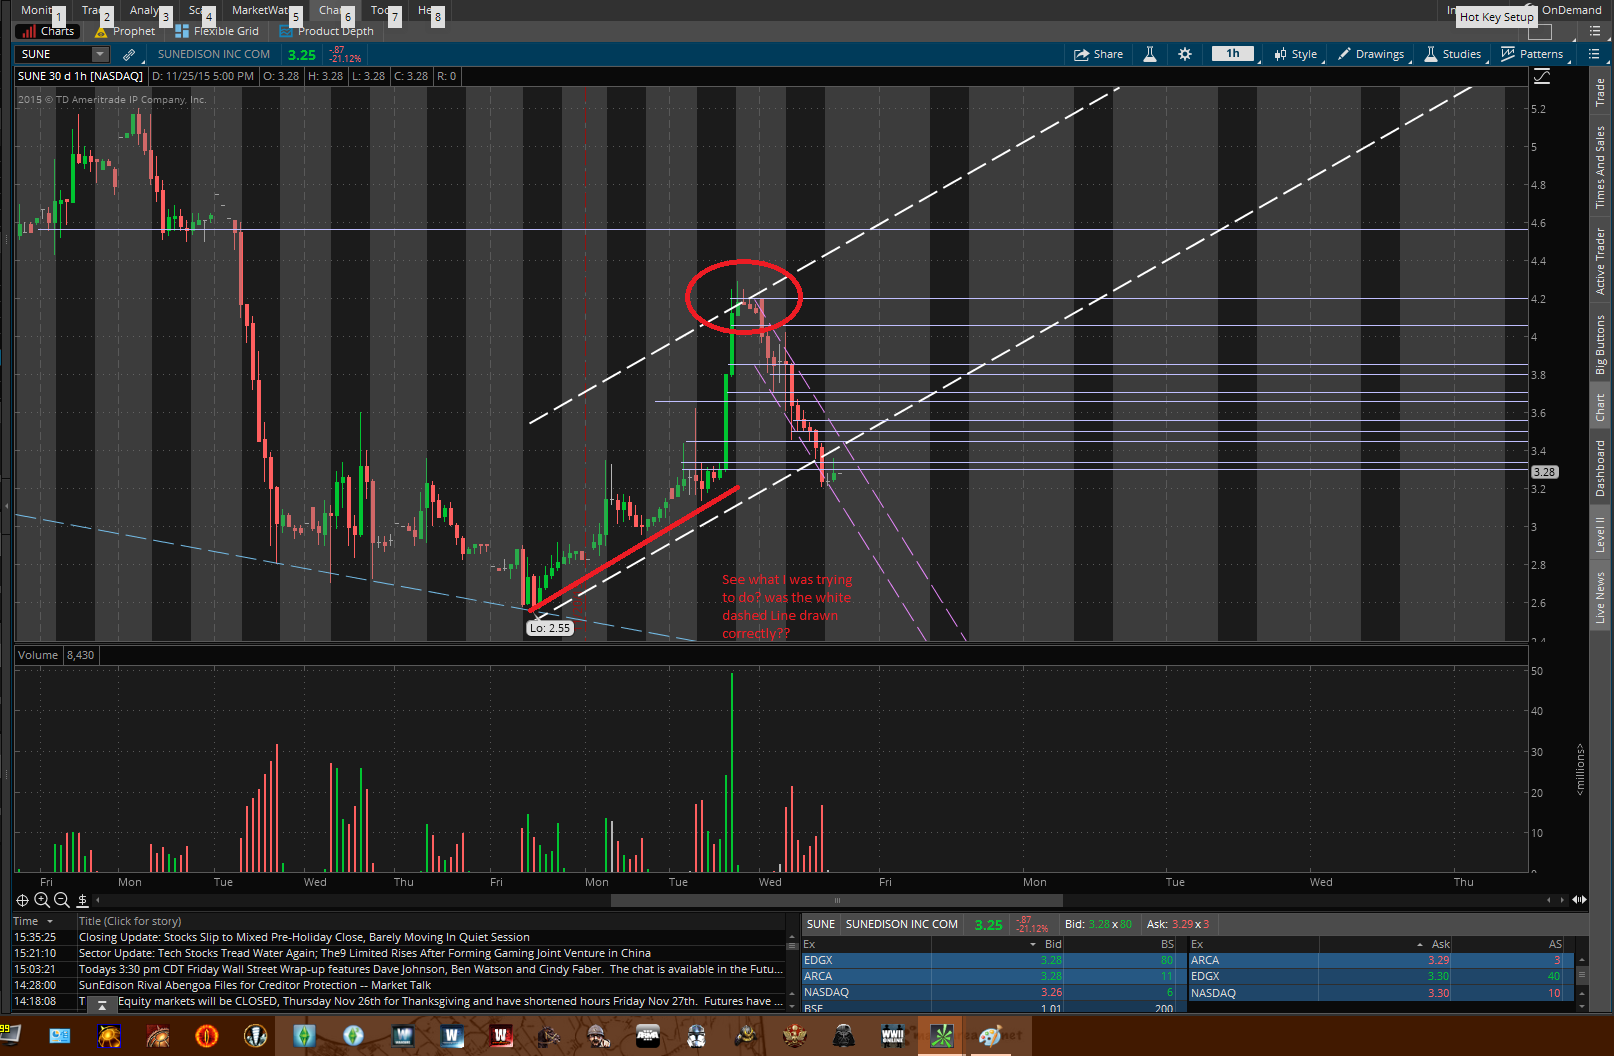
I'm not sure I did the white trend channel correctly. Was it even possible to draw one here? Either way, it was working for a while.
LASTLY, I drew my daily trendline. This is seen as a dashed purple line.
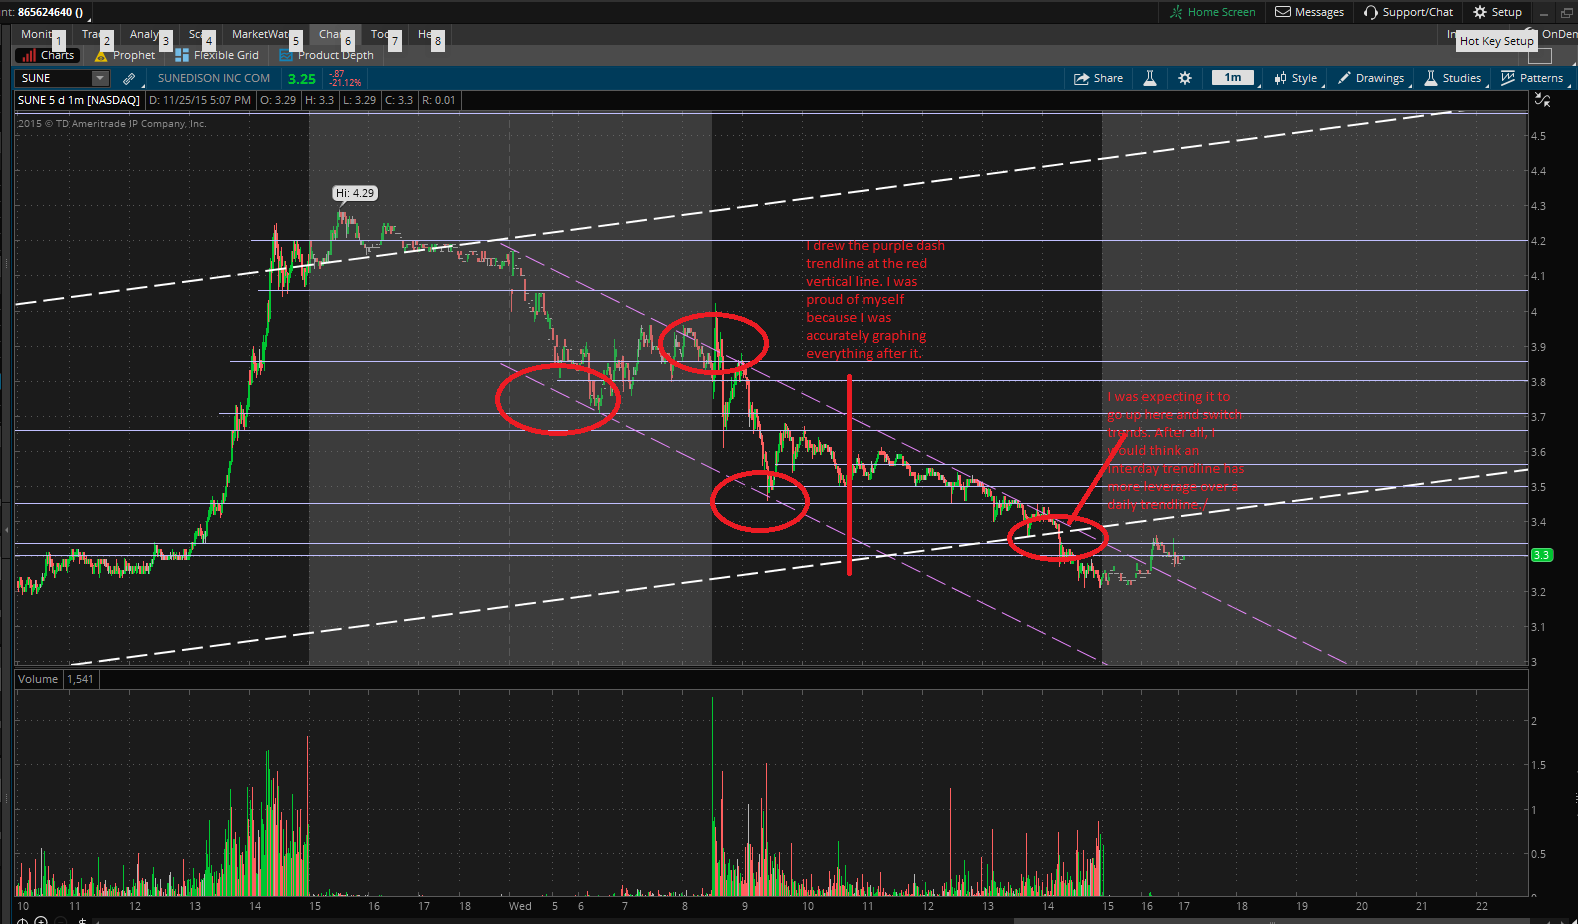
I drew this line using the bottom 2 lows on the downward trend. This also happened to work out well for the highs on the downtrend. (as it should when drawing channels).
HERE is where I get confuzzled. At first, I was happy that my purple trendline was holding up so well. Since the minute I drew it, the chart was following nicely. I was sitting back saying to myself "Man this is so predictable."
That is until it got to the white trendline. (weekly) I was assuming it would follow the weekly trend. There was no news to send it downwards more, so if anything, it should have bounced off the white trendline, or in other words, been a perfect dip buy.
SO, I was shocked when this happened. I was fortunately, not invested, but still- I went over my drawings again to see if I misplaced them. As far as I can tell, I misplaced my weekly/ white trendline. Does anyone else see this? is there a better way I could have placed it? cause I dont see it.
Furthermore, Am I placing too much emphasis on the technical analysis stuff? should I not treat this newfound power of stock prediction like a superpower? what are your thoughts?
Have a great Thanksgiving, and invest smartly. In other words, do the opposite of me :/
Expect and and all technical analysis to be fairly accurate. Treat it as a "give or take" kinda scenario. It's very useful but not an exact science. In conclusion, treat it as a guide to find the trend but don't use it as an exact or precise entry/exit point. Use your better judgment for entries and exits.
Your trend lines look good. Remember to check multiple time frames for support and resistance levels. There was old support at $3.30/3.20 that turned into resistance. Your stock followed your trendline to a T and then hit the resistance level. Your trend lines are good, keep doing that. But make sure you cross reference your trend lines with Tim's steps of checking multiple days/weeks/months support and resistance levels. In this way you can have your complete "stakeout" of your stock executing
Join now or log in to leave a comment