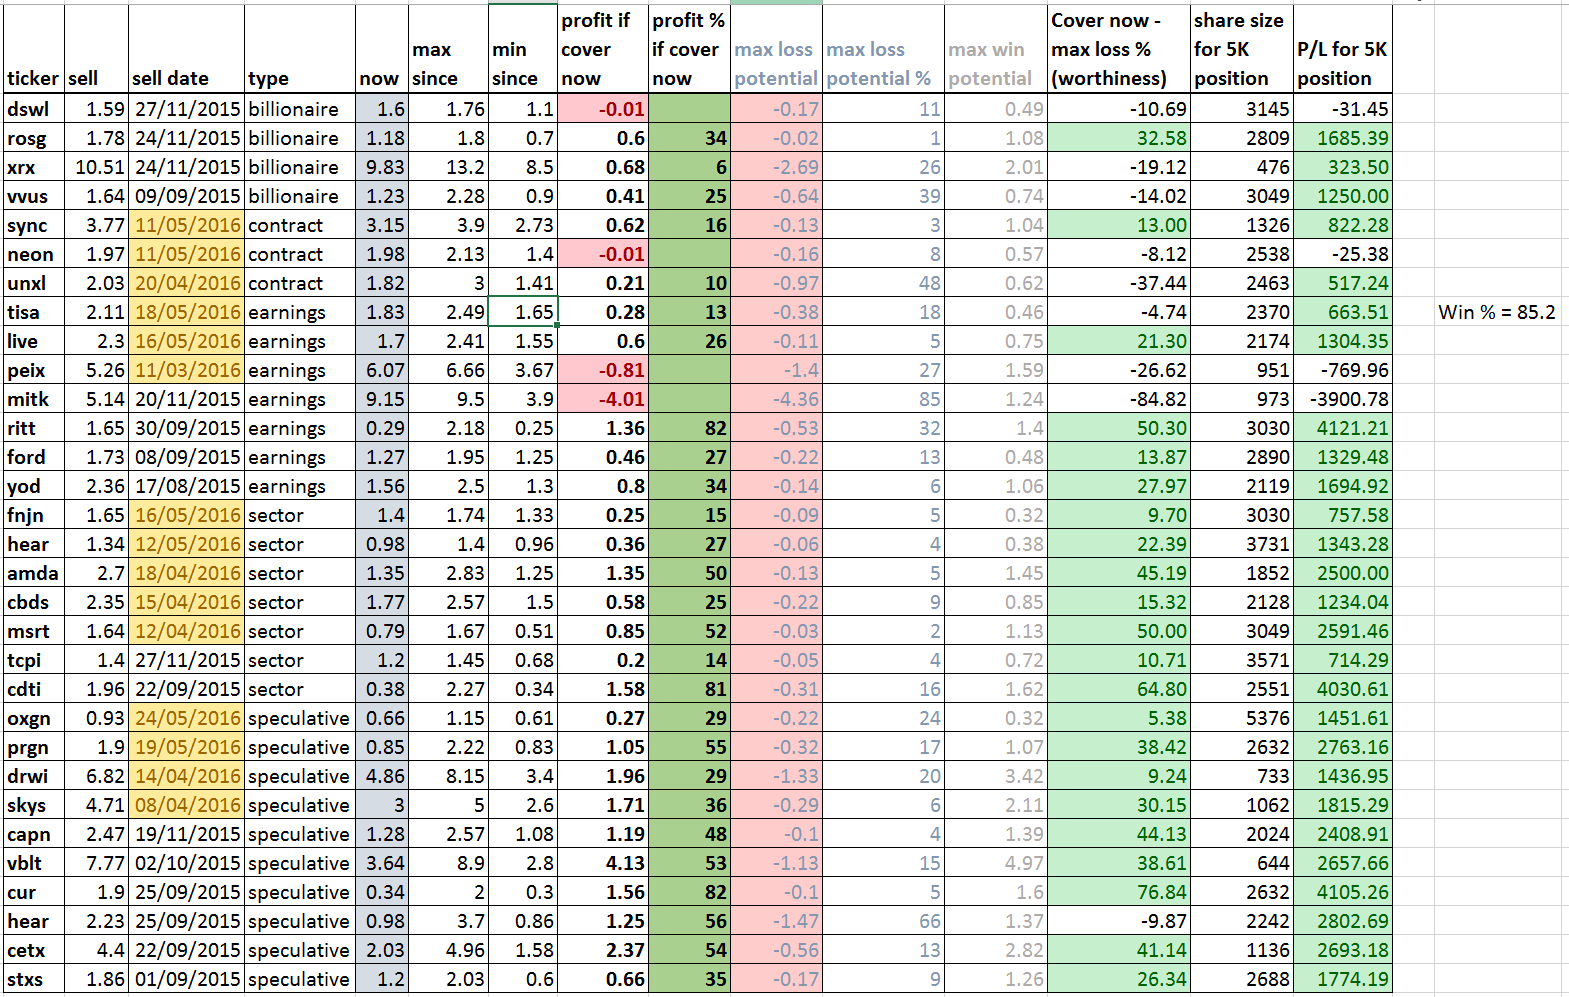
Over the long weekend I have devised an xls file with some random trades from Tim. I wanted to see and sort-of recap what happens with these stocks.
My curiosity kicked in and so I wanted some data for myself.
Then I thought you may also want to see and not go through all the tedious work of compiling and formulas so I share it with you.
The only criteria I have set was it had to be a long position and it had to be profitable.
This took some time - I added what the high of the range was, what the low of the range was ever since Tim exited his profitable trade. I calculated per share and % maximum profits and losses (the max profits are just for fun, nobody will really cover everything on the low all the time. The max losses are somewhat imaginable if you have ever put on a short position).
I wanted to know what happens with these stocks once the runup and the chatrooms' and twitters' hype is over.
Given these are mostly crappy companies I had to have little imagination what they will do :)
I want you to draw your own conclusion, I have mine too already but bear in mind that there are no surprising conclusions as to Tim talks about what most likely happens with these stocks in his DVDs.
I have seen them all at least twice, if you have no idea what I am talking about then off you go, get some education.
For me, these are def some more trade ideas.
As for you, see it for yourself and please comment.
What's your thesis and how does this help your trading moving forward:?
Join now or log in to leave a comment