
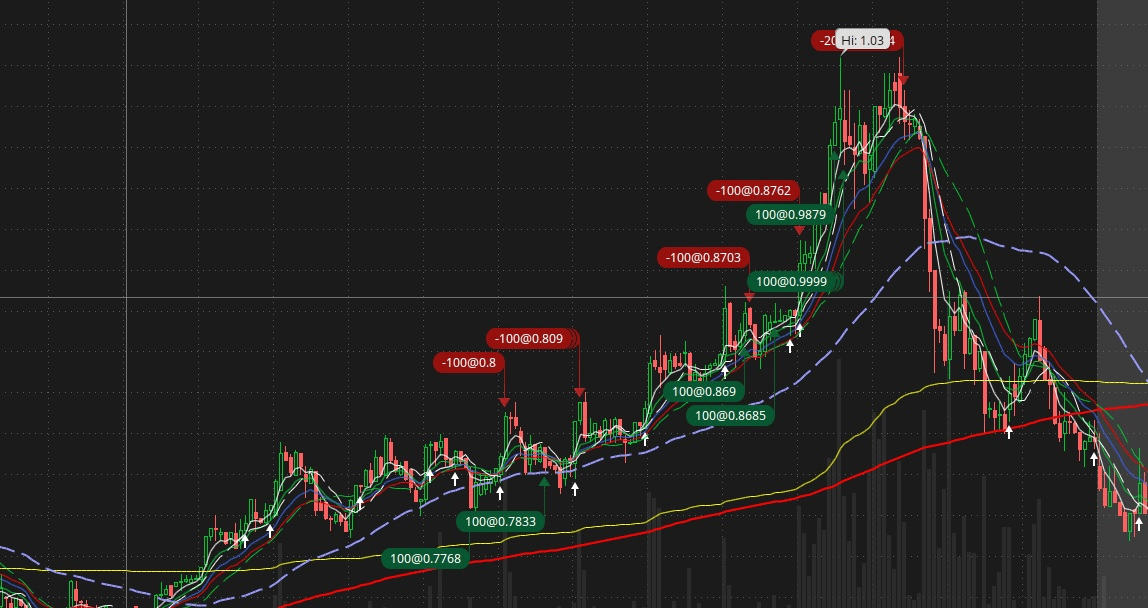
My scanner identify this stock as current day runner. Stock behaved as a crazy horse on field, but then I see a pattern. Couple steps Up, couple steps down, and it repeated itself, bounsing fro 50 SMA. I have EMA and SMA on a daily chart. Tim describe this chart as a stepper. SO, I start "claiming" the steps... Exit on the last step, or platform , just to see stock plunge into oblivion.... Take a look at the pic.
Newsletters:TimChallenge
Broker:ThinkOrSwim
Join Now
| Date | Price | |
|---|---|---|
| Entry | 11/20/2025 | 0.7768 |
| Exit | 11/20/2025 | 0.80 |
- Total Views45
- Position Size100
- Percentage2.99%
Proof
Copy and paste the following into your page or blog. If using WordPress, you must paste this in the HTML tab only: