
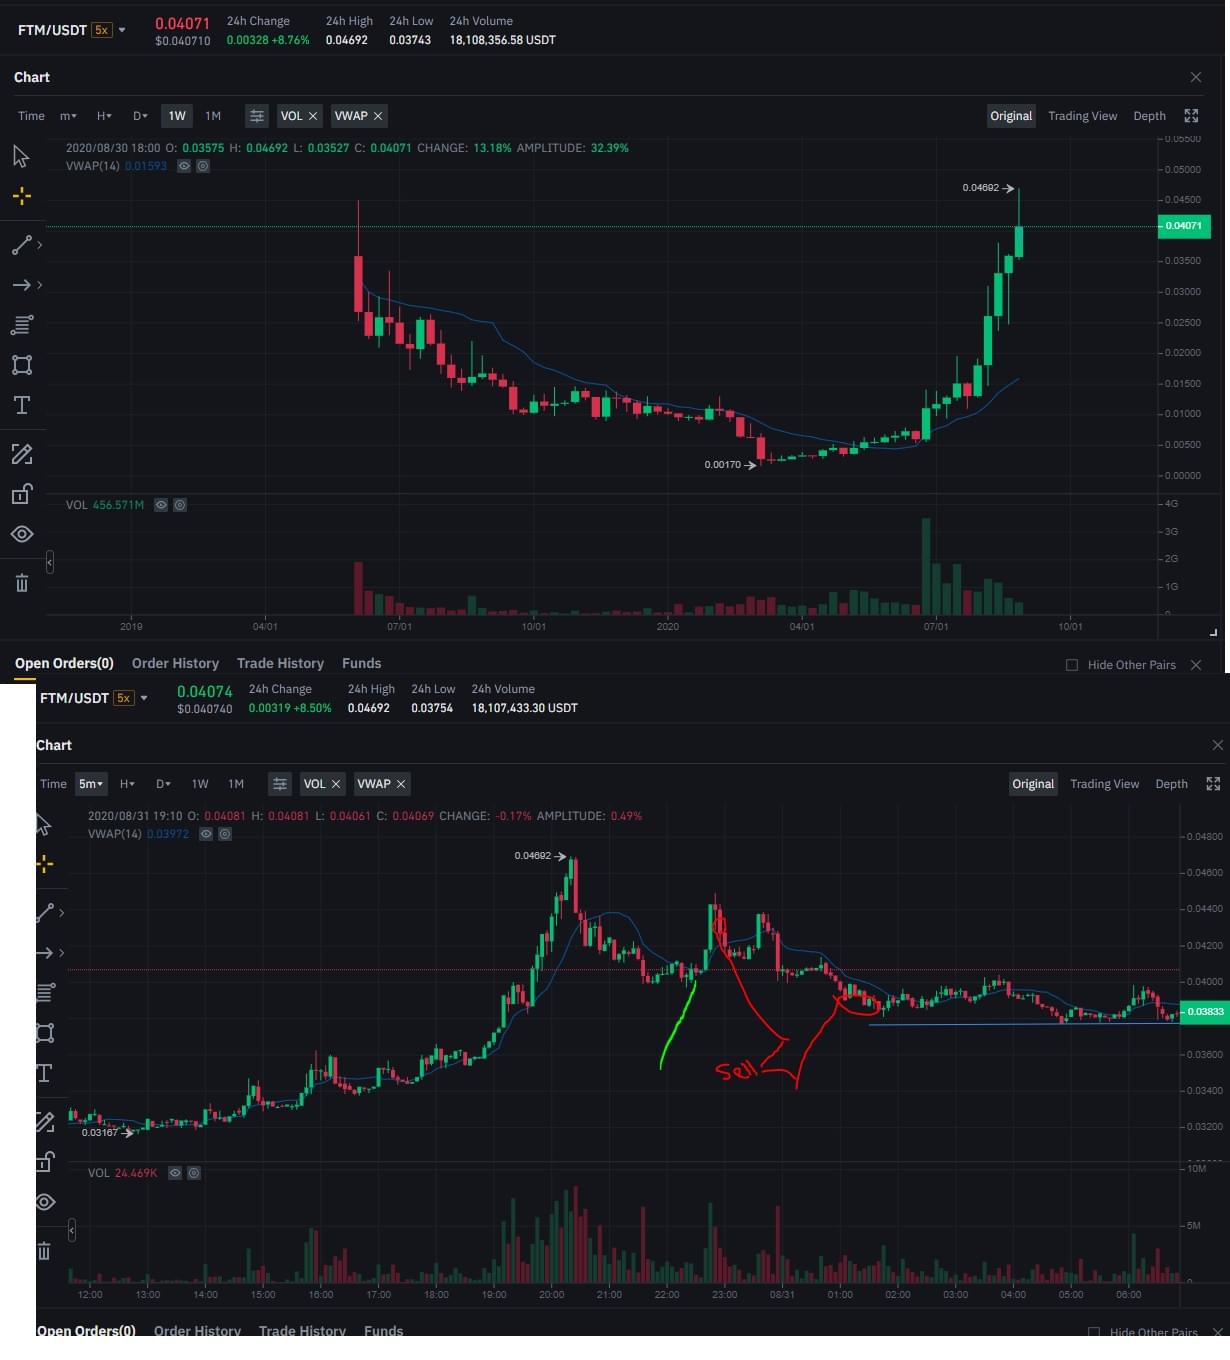
Best looking chart that I have ever seen. Screaming for a parabolic breakout. I bought the dip on the first failed breakout attempt. And have traded it multiple times the following day. It's been going sideways ever since the first failed breakout. It hit my stop loss while I was asleep. I had set it beneath 1-day support
| Date | Price | |
|---|---|---|
| Entry | 8/30/2020 | 0.0403 |
| Exit | 8/30/2020 | 0.0398 |
- Total Views59
- Position Size5,000
- Percentage-1.24%
Proof
Copy and paste the following into your page or blog. If using WordPress, you must paste this in the HTML tab only: