
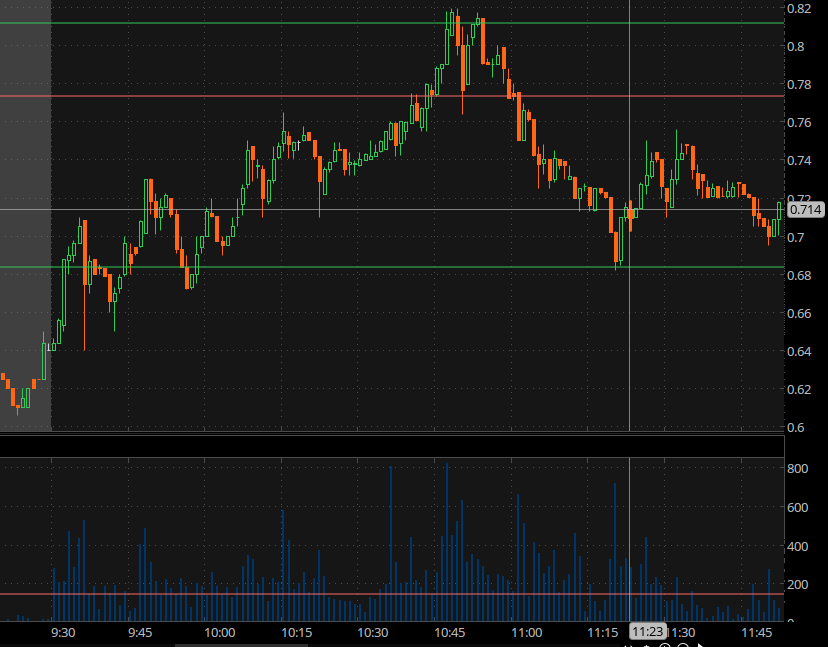
This chart proves I should buy stock when it hits support resistance level. I bought it after a 15% panic followed by a nice long green candle and a small candle with volume. This was a good support resistance point. Sold it into strenght after 4 minute of the stock slowly rising for fear it would break down quickly.
Broker:TDAmeritrade
| Date | Price | |
|---|---|---|
| Entry | 5/6/2020 | 0.7144 |
| Exit | 5/6/2020 | 0.7348 |
- Total Views127
- Position Size141
- Percentage2.86%
Proof
Copy and paste the following into your page or blog. If using WordPress, you must paste this in the HTML tab only: