
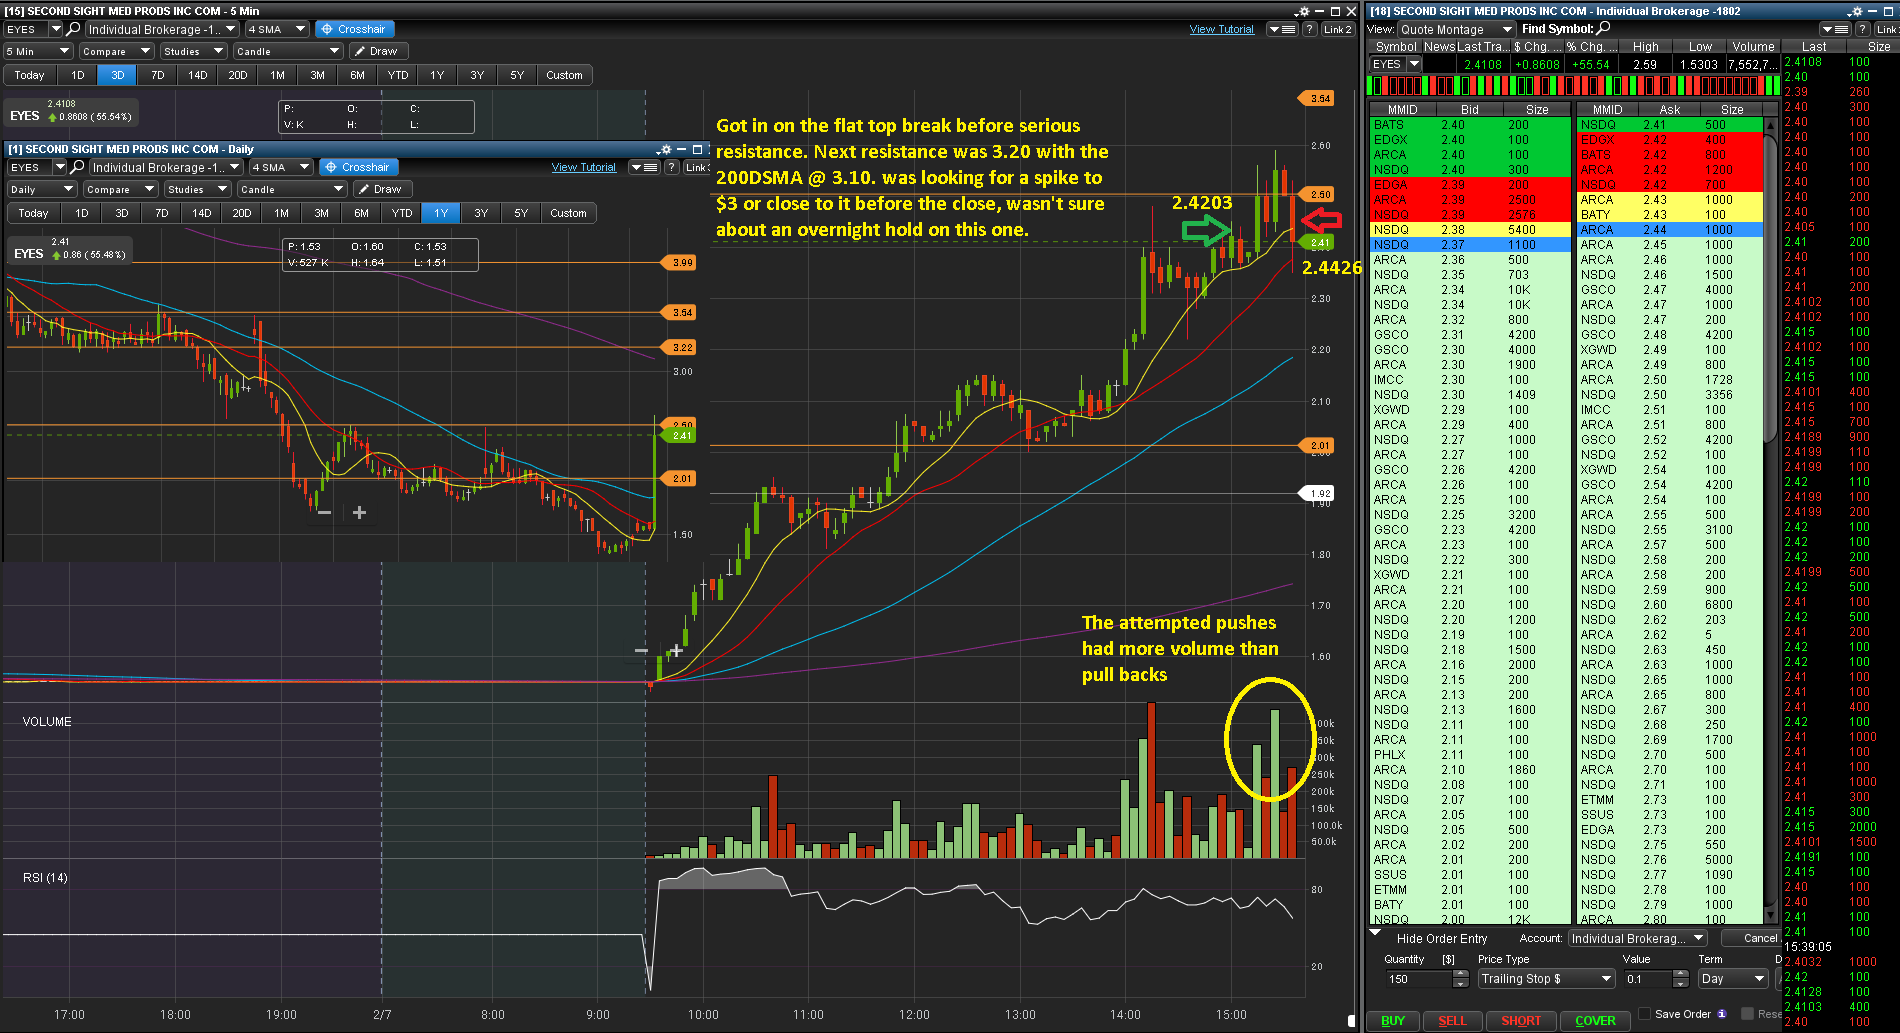
Chart respects its R/S levels and has a solid level at 2.50 with the next one being 3.20 and the 200DSMA at 3.10. 5min chart showed flat top at 2.40 and has been uptrending all day. Bought the break over 2.40 with a stop at 2.35. Moved up my stop a couple times then changed to a .10 trailing stop that got hit. The stock was up 50% already but my thesis was sound, just not enough buyers came in over 2.50 like I expected. Turns out this got above 2.75 where I would've locked in profits anyway...
Broker:ETrade
| Date | Price | |
|---|---|---|
| Entry | 2/7/2017 | 2.4203 |
| Exit | 2/7/2017 | 2.4426 |
- Total Views424
- Position Size150
- Percentage0.92%
Proof
Copy and paste the following into your page or blog. If using WordPress, you must paste this in the HTML tab only: